
Lab 1.3 – How do you know exactly where you are on Earth?
Fundamental concept: Use latitude and longitude on maps to identify locations on earth
Preparation for: All labs
Estimated time to complete: Approximately 40 minutes
Materials needed: Printouts of a world oceanography map and maps from activity and a ruler or straight-edge are useful but not required. Additional practice with latitude and longitude is required for proficiency.
We use our cell phones or our car’s navigation system for directions to an address, but how does the phone know its location? What if we are out on the ocean where there are no roads or street signs, how do oceanographers know where we are on the vast blue ocean with no land in sight? Global positioning systems, otherwise known as GPS, are used to find locations on Earth from satellites. Multiple satellites are used to triangulate our position using a grid system overlaid onto the surface of the Earth called Latitude and Longitude.
Tutorial: Latitude and longitude. Select the ⊕ sign for information.
Figure 1.3.1

Figure 1.3.2. Latitude lines. Red depicts the equator, latitude in degrees north are in yellow and degrees south are in green. Created by Benjamin R. Jordan 2021. Base map from NASA.
Latitude lines start at the equator or 0 degrees (°) latitude. Latitude lines run east and west, parallel to the equator, and are measured in degrees north or south of the equator to 90° at the North or South poles. Latitude lines are equidistant from one another. One degree of latitude is divided into 60 minutes (‘). A minute of latitude is 1.15 miles or 1 nautical mile. One minute of latitude is further divided into 60 seconds (”). We represent latitude in degrees, minutes and seconds, with the direction of North (+) or South (-); for example: 27° 12’ 28” N. Degrees north are referred to as the northern hemisphere, while degrees south are the southern hemisphere. We also divide the earth based on climate into tropics (0-23.5 degrees N or S), Subtropics 23.5 – 30 degrees N or S), temperate (30-60 degrees N or S) and polar areas (60-90 degrees N or S). While these are not exact cutoff latitudes, they may vary by 5-10 degrees, they provide a relative visual for climate zones that are important to biological, physical and chemical oceanography.
Now that we know how far north or south of the equator we are, we need to know a more precise location. After all, we could be anywhere around the globe at the same latitude. The second part of the grid system we use is called Longitude. Longitude lines, or meridians, run from the North Pole to the South Pole. Unlike the equator that is the center of the sphere, the Prime Meridian or 0° Longitude is artificially set to run through Greenwich, England. It has been moved several times throughout history to run through other major cities. Longitude lines run north and south from pole to pole, which means they are not equidistant at different latitudes, they are farther apart at the equator than they are toward the poles. It takes the earth 24 hours to complete one rotation or 360°. So for every hour the Earth rotates 15° Longitude (360 degrees/24 hours = 15 degrees/hour). Longitudes are measured east or west of the Prime Meridian to 180° which is the Anti Meridian or the International Date Line. Longitude is written in degrees, minutes and seconds with the direction East (+) or West (-) of the Prime Meridian; for example: 85° 15’ 32” W.
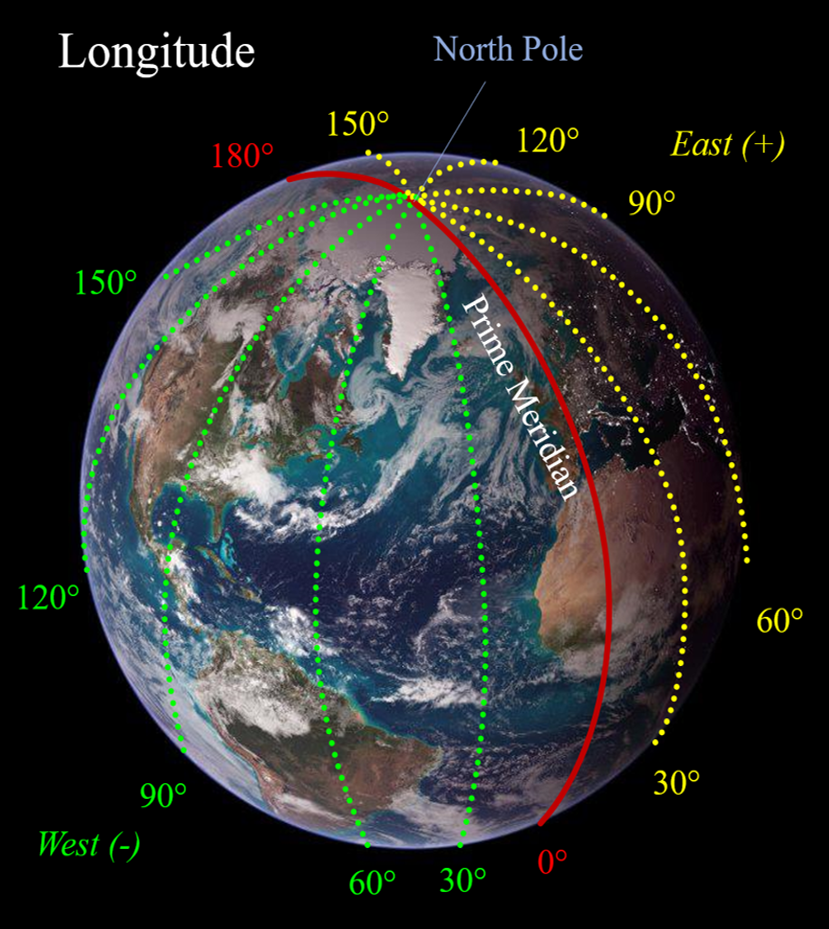
Figure 1.3.3. Longitude lines with degrees East depicted in yellow and degrees West depicted in green with the Prime Meridian in Red. Created by Benjamin R. Jordan 2021. NASA image.
With newer digital technology, latitude and longitude may also be expressed in decimal degrees. If you are plotting locations on a map with digital software, you will need to convert using one of the many latitude and longitude converters online. Just remember that with decimal degrees you will use positive (+) for east and north, and negative (-) for west or south. For our purposes, we will use the historic degrees, minutes and seconds format. When writing a location you must include both the latitude and longitude, starting with the latitude first; for example: 27° 12’ 28” N, 85° 15’ 32” W. Remember that without a cardinal direction (N, S, E, W) you would be lost!
Reading latitude and longitude scales on maps
When looking at maps, it is important to not only pay attention to coastlines, ocean basins and ocean features, but you need to pay attention to the latitude and longitude scale for that particular map. Similar to identifying the scale on an x or y-axis for a graph, tick marks or graticules between two degree numbers may be designating degrees, minutes, seconds or a combination depending on how zoomed in on a location on the map. Lets take a look at a simple example first. Click on the question marks to learn more about reading these latitude and longitude scales. Remember that 1 degree is equal to 60 minutes, similar to reading a clock where 1 hour is 60 minutes and 1 minute is 60 seconds! (You are just replacing the ‘hour’ with degrees and there more degrees on earth than hours on a clock because they are based on angles- but, I think you get the idea!) You can use this information to determine the scale by looking at how many graticules or tick marks there are between the latitude or longitude on the scale. You can then estimate an even smaller scale between the tick marks.
Tutorial: Reading latitude and longitude scales. Select the “?” signs for information
Let’s take a look at a couple more examples on actual maps. Notice in figure 1.3.4 below: in scale A, both the latitude and longitude tick marks are equal, 30 minutes or 1 degree every 2 tick marks. In scale B, the latitude and longitude are different, the latitude tick marks depict 15 minutes each and the longitude tick marks are 20 minutes or 1 degree every 3 ticks. It is also very important to pay attention to the direction for increase or decrease. In scale A, you are increasing in latitude from top to bottom of the diagram while in scale B you are decreasing in latitude from the top to the bottom of the diagram.

Figure 1.3.4
Quick Check for reading latitude and longitude scales on maps:
Latitude and Longitude Activity
Orientation Questions
The following diagram (Figure 1.3.5) depicts the Ocean Observatory Initiative (OOI) Arrays.
- In figure 1.3.5, how many degrees is each tick mark or graticule for latitude and for longitude?
- Which OOI Array is located at 42° 55′ S, 42° 26′ W?
- Which OOI Array is located at 50° 4′ N, 144° 48′ W?

Figure 1.3.5 OOI Array Locations.
Use the following maps Figures 1.3.6-1.3.9) to identify the plotted latitude and longitude, in degrees (°) and minutes (‘) only due to the size of the maps, for surface moorings located within each OOI Array. Remember to include direction N, S, E or W. Find the latitude and longitude of the center of the circle next to the array name.


- In figure 1.3.6, how many degrees or minutes is each tick mark or graticule for latitude and for longitude?
- What is the latitude and longitude of the Global Southern Ocean mooring (Figure 1.3.6)?
- What is the latitude and longitude of the Global Irminger Sea mooring (Figure 1.3.7)?
- What is the latitude and longitude of the Coastal Pioneer surface mooring(Figure 1.3.8)?
- In figure 1.3.9, how many degrees or minutes is each tick mark or graticule for latitude and for longitude?
- What is the latitude and longitude of the Coastal Endurance surface mooring (Figure 1.3.9) ?
Each OOI Array consists of moorings, platforms, and sensors that are at different latitude and longitude, depth, distance from shore or other geographic location. Some equipment is mobile, while others are fixed. For instance, in lab activity 1.4, you will learn about zooplankton migration during the solar eclipse August 21, 2017. The data collected to detect this phenomenon was collected at the Endurance Array. The Coastal Endurance Array has an Oregon and Washington line. The purpose of the Endurance Array is a multi-scaled array that utilizes both fixed and mobile assets to observe cross-shelf and along-shelf variability in the coastal upwelling region of the Oregon and Washington coasts. The array also provides an extensive spatial footprint that encompasses an eastern boundary current and has connectivity with the OOI Cabled Array. The diagram below depicts the entire area of the Endurance Array.
- What is the approximate range of latitude, to the nearest degree and minute only, that is covered by the mobile assets (represented by small airplane-looking icon on map) in the following diagram (Figure 1.3.10)?
- What is the farthest west longitude, to the nearest degree and minute only, that is covered by the mobile asset? (note: the dotted lines represent the tracks of the gliders).
Figure 1.3.10 Coastal Endurance Array glider path.

Figure 1.3.10 Coastal Endurance Array glider path. The dotted lines represent the survey pathway for the gliders.