
Lab 12 – Wildfires
At some point in our lives, many of us have had the experience of sitting around a campfire. Occasionally, the smoke was blown into our face. What are some of the characteristics of this smoke plume? Recall the dry heat and the ash that perhaps made you cough a bit. These same characteristics of smoke are present in wildfire smoke.

Friends enjoying a campfire (Ourgreengenes.org)
The much larger smoke plumes produced by wildfires drift over streams, lakes, and occasionally, the open ocean. In this lab, we are going to look at the impacts of smoke plumes over the ocean, as they produce observable physical, chemical, and biological changes.
How do wildfires impact the ocean ecosystem? Watch this video to find out:
Source: Sasha Kramer/California Ocean Science Trust.
Video Quick Check
Test your knowledge after reviewing the video above.
2020 Oregon Labor Day Fire
In September 2020, a wildfire outbreak spread quickly across western Oregon causing significant damage and shrouding the region in smoke for more than a week. Smoke from these fires, driven by an easterly wind event, could be seen from satellites (see Figure 12.0.2). The smoky air was measured by the Coastal Endurance Array’s Oregon Shelf Surface Mooring 10 nautical miles west of Newport, Oregon, which measured the lowest relative humidity values (<18%) since it was first deployed in April 2015. These winds and the associated smoke plume were followed by a week of reduced sunlight. Six meters below the surface, sunlight was reduced by the red smoke. Closer to shore at the Oregon Inshore site, light levels were measured throughout the water column by an OOI coastal surface piercing profiler. The smoky air had relatively high concentrations of carbon dioxide and other ocean nutrients capable of producing an algal bloom.
The satellite image below shows the smoke plume over the Endurance Array in Coastal Washington and Oregon on September 9, 2020. In the image below, the red circles indicate the locations of the wildfires during this outbreak.
[caption id="attachment_14508" align="alignnone" width="592"]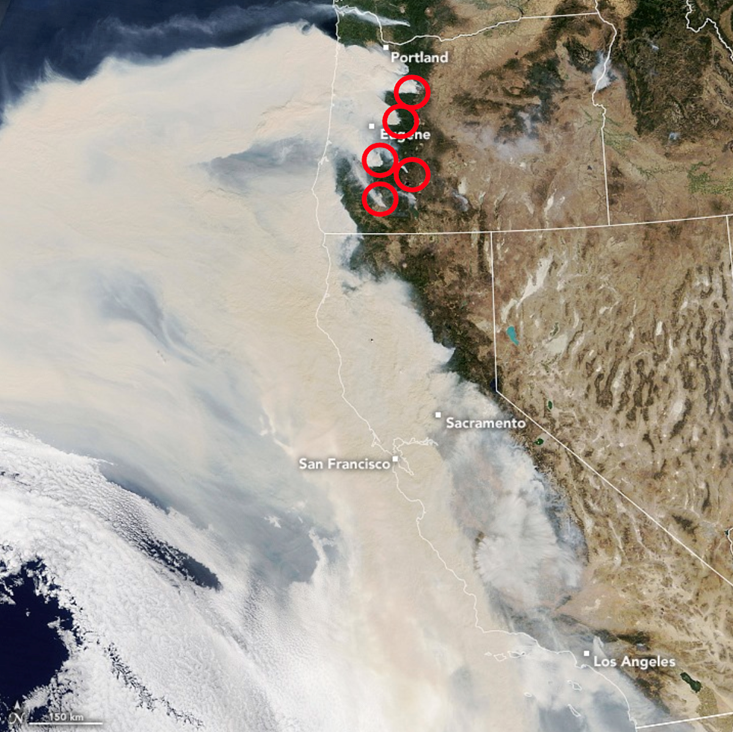 Figure 12.0.1. The satellite image above shows the smoke plume over the Endurance Array in Coastal Washington and Oregon on September 9, 2020. In the image, at the extreme eastern edge of the smoke plumes, in the region of the red circle. is the location of the wildfires.[/caption]
Learning Outcomes
- LO1. Understand the connection between climate change and wildfires.
- LO2. Investigate patterns in individual data sets (relative humidity, shortwave irradiance, wind direction, air temperature) to identify the arrival date of the smoke plume. Describe the correlations between the different data types presented.
- LO3. Investigate patterns in individual data sets (sea surface temperature, backscatter, CDOM) to identify the ocean response to the smoke plume. Describe the correlations between the different data types presented.
- LO4. Make connections between wildfires and algal blooms (chlorophyll a, dissolved oxygen) and explore the consequences of these blooms for the ocean and society.
Background Information
Key terms: phytoplankton, CDOM, chlorophyll, nitrate, wildfire plume, eutrophication, dissolved oxygen, harmful algal bloom (HAB), optical backscatter, irradiance, sea surface temperature, abiotic, biotic
Wildfires require the alignment of a number of factors, including warmer temperatures, low humidity, and the lack of moisture in fuels, such as trees, shrubs, grasses, and forest debris.
Wildfire activity changes with climate conditions, as demonstrated in Figure 12.0.2. An average annual temperature increase of just 1℃, increases the land area burned by 600%. Additionally, drier conditions produce a longer fire season.

Figure 12.0.2. Climate change – wildfire feedback loop. (Adapted from Global Forest Watch)
Although many fires are started by lightning and other natural causes, 80% of fires are started by people. Forest fires create extensive plumes of smoke and ash, many of which may move over marine environments. Evidence suggests that the influx of nutrients deposited by smoke plumes may, under the right conditions, allow for the formation of marine algal blooms. The extent of the bloom depends on many factors in the marine environment. In this lab, we will explore the impacts of the 2020 Labor Day Fire as the smoke plume drifted over the Coastal Endurance Array off the coast of Oregon.
Data collection
We will use data collected by the Ocean Observatories Initiative (OOI), an initiative that has stationed equipment for collecting data in different locations around the world. Our data comes from the Coastal Endurance Array off the coast of the northwestern part of the USA (see map below).

Figure 12.0.3. Global OOI Array Locations
In order to view the events with the greatest clarity, we have opted to use two different moorings within the Coastal Endurance Array: The Oregon Offshore Surface Mooring and the Oregon Shelf Surface Mooring.

12.0.4 Diagram showing the cross-sectional view of the Endurance Array Oregon line.
The Coastal Endurance Array is designed to observe cross-shelf and along-shelf variability in the region. The three sites across the shelf and slope are associated with characteristic physical, geological, and biological processes. All six sites contain fixed sensors at the top and bottom of the water column paired with an adjacent water column profiler. Four of the sites have a Bulk Meteorology Instrument package, and all six sites contain fixed sensors at the top and bottom of the water column paired with an adjacent water column profiler.


