
Lab 11.2 – pH Peacekeepers: How Carbonate (CO₃²⁻) Saves the Seas
Fundamental concept: Link patterns in ocean CO2 to ocean pH and carbonate chemistry
Estimated time to complete: 30 minutes
Data skills preparation:
Materials needed: None
Even a small decrease in ocean pH, a phenomenon known as ocean acidification, can have significant impacts on marine life and ecosystems. Lowering the pH reduces the availability of calcium carbonate, a key building block for shells and skeletons, potentially leading to shell dissolution and other physiological problems. In this activity you will learn about the pH scale and how the ocean responds to changes in pH.

A primer on pH by NOAA is licensed under the public domain. Original Source.
Quick Check Questions
When carbon dioxide dissolves in the ocean, it influences shell-forming organisms in two ways.
The first is through a change in pH. Carbon dioxide (CO2) interacts with water (H2O) to form carbonic acid (H2CO3). However, carbonic acid rapidly dissociates in water to form bicarbonate ion (HCO3–), releasing a hydrogen ion (H+) in the process. This increase in free hydrogen ions leads to a reduction in pH, leading to more acidic waters than can dissolve calcium carbonate (CaCO3) shells.
Use the drag and drop to explore this equation visually.
The second is through the ocean’s carbonate buffering system. The ocean carbonate buffering system is a natural mechanism that helps regulate the ocean’s pH, preventing it from becoming too acidic or too basic. It works through a series of chemical reactions involving carbon dioxide (CO₂), water (H₂O), carbonic acid (H₂CO₃), bicarbonate (HCO₃⁻), and carbonate (CO₃²⁻).
To maintain equilibrium, the additional hydrogen ions produced from the interaction between CO₂ and H₂O bind with carbonate ions, forming bicarbonate. : As a result, a decline in pH reduces the availability of free carbonate ions, making it harder for organisms to form calcium carbonate shells.
In summary, some organisms can’t make shells because there are fewer carbonate ions and organisms struggle to extract enough material to build strong shells. In more acidic water existing shells can dissolve, especially in young or weaker organisms. All of this results in increased energy cost, some organisms may still build shells, but at a greater energy expense, which can impact survival and reproduction.
Carbonate Buffering System

DIC Speciation by Microbialmatt is published as CC-BY-SA. Original Source
Use the figure above to answer the following questions. The unit used in the y-axis of this graph is millimolar (mM 10−3). The x-axis is the pH scale. For reference, the pH of pure water is 7 and the average pH of the ocean is 8.1.
Interpretation Question
- Discuss the trends you recognize in the dissolved inorganic carbon graph and their relationship to the pH of the ocean.

The above graphs show CO2 and pH data from the Pioneer MAB array in July 2024. Answer the following questions based on the data shown.
Orientation Questions
- What variable is displayed on the x axis?
- What is the minimum and maximum of the data presented in the x axis.
- What variable is displayed on the y axis of the bottom graph.
- What is the minimum and maximum of the data on the y axis on the bottom graph
- What variable is displayed on the y axis of the top graph.
- What is the minimum and maximum of the y axis of the top graph.
- What type of graph is displayed in this figure?
- What is the correlation between pH and aqueous CO2 .

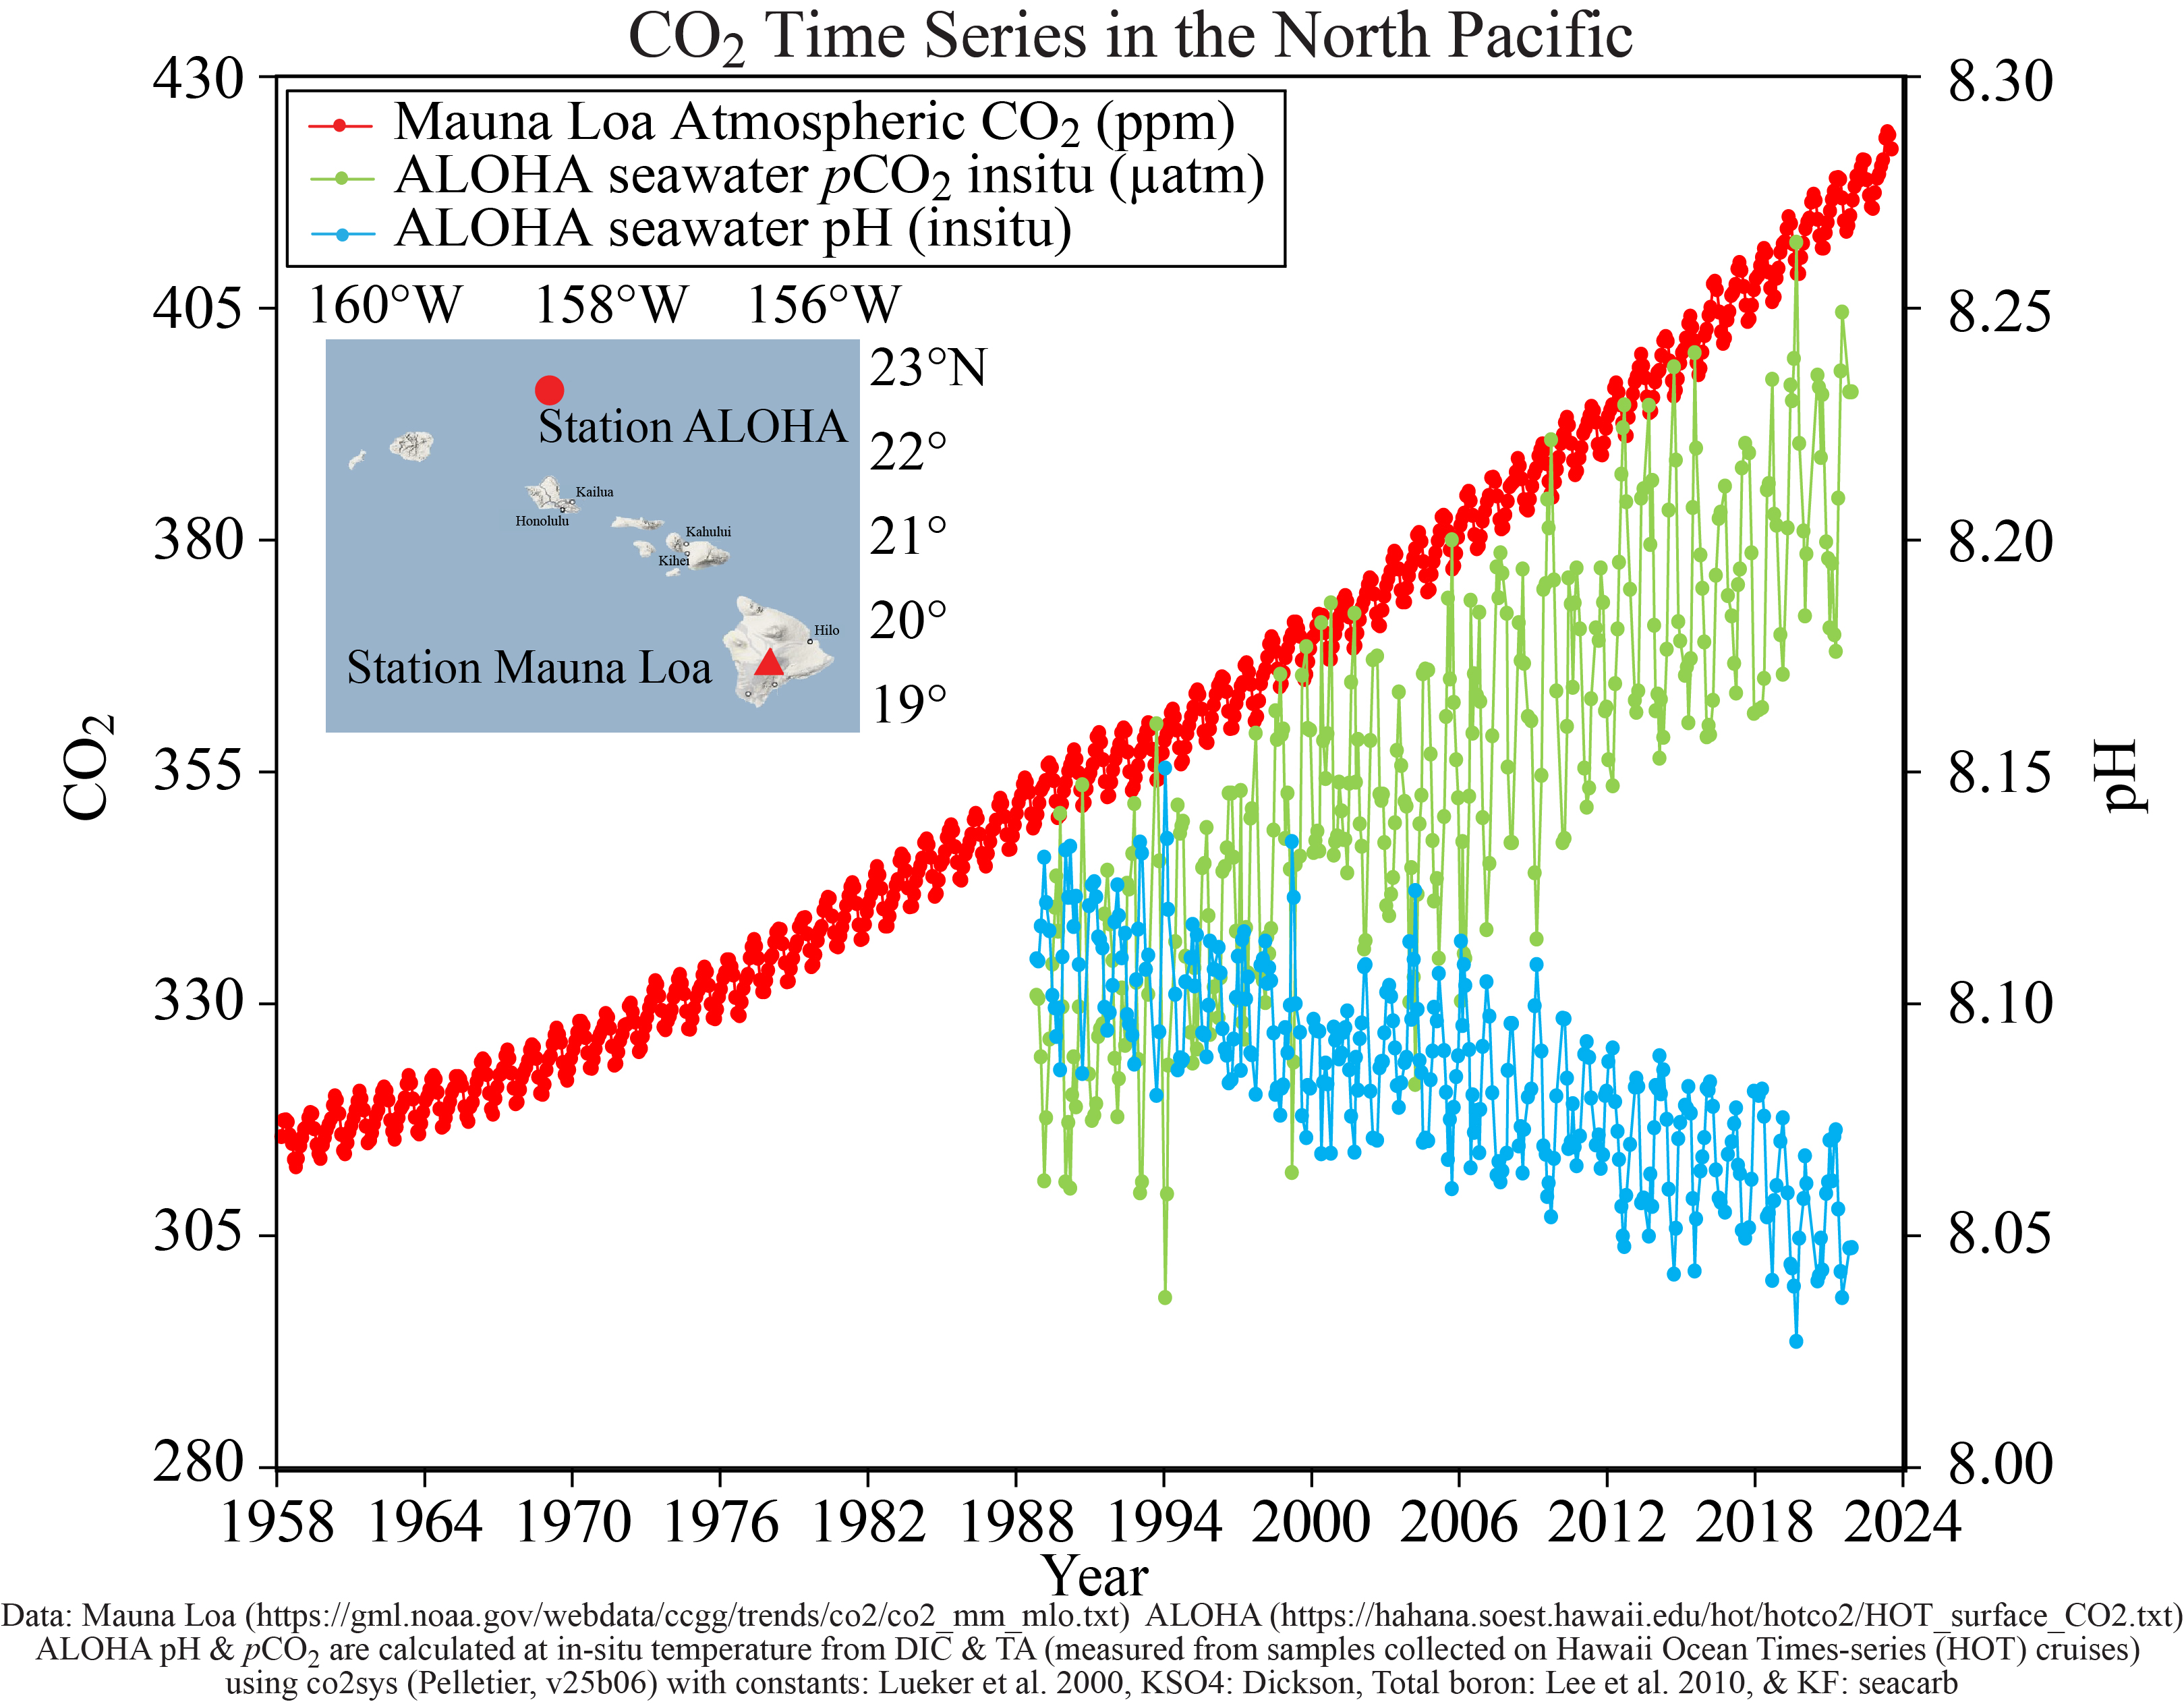
CO2 Time Series in the North Pacific by NOAA is licensed under the Public Domain. Original Source.
Orientation Questions
-
- Where were these data collected?
- What variable is displayed on the x axis?
- What is the minimum and maximum of the data presented in the x axis.
- What variable is displayed on the primary y axis (left). Which two curves does this correspond to (red, green or blue)?
- What is the minimum and maximum of the data on the primary y axis (left)
- What variable is displayed on the secondary y axis (right). Which curve does this correspond to (red, green or blue)?
- What is the minimum and maximum of the data on the secondary y axis (right).
Interpretation Questions
-
- Describe the correlation between atmospheric CO2 and seawater pCO2.
- Describe the correlation between CO2, pCO2, and pH.
- positive correlation
- negative correlation
- no correlation
- What type of environmental change does this graph indicate?
- hydrogen ions are being produced, decreasing the pH
- hydrogen ions are being produce, increasing the pH
- hydrogen ions are being consumed, decreasing the pH
- hydrogen ions are being consumed, increasing the pH
- Discuss what impacts these conditions may have on the marine environment in this region.