Dynamic Air-Sea Interactions - Instructor's Guide
Published December 2, 2019
Summary
This exercise is a case study that, if used in full, takes students through the parts of the learning cycle from exploration to application as applied to an episodic atmospheric event on the New England continental shelf. Pieces of the exercise can be used as appropriate for the instructor goals. Several ideas are given for having students access and connect to their previous learning on ocean surface conditions (invitation). The tie-in to societal impacts is compelling. Some wave properties data are presented and students are asked to draw some conclusions (exploration). Several types of data are presented as time series data with an interactive widget, and students are asked to speculate on the relationships between the wave properties and different water and atmospheric conditions (concept invention). Students are then presented with barometric pressure data and asked to predict precipitation. After their prediction, students can compare to the actual precipitation data (application).
Once students come to a conclusion as to the cause of the event, students are invited to reflect on how this oceanic event affects their life. This case requires students to think of the interaction between atmospheric and sea surface conditions, and the impacts to coastal societies (reflection).
Learning Goals
After engaging with this Data Exploration a student will be able to:
- Describe patterns in individual data sets and correlations between the different data types presented
- Interpret the data provided
- Explain the relationship between oceanic conditions and episodic atmospheric events on the New England continental shelf using evidence and relevant scientific concepts to support their conclusions.
Context for Use
This exercise could be used for either lower level or upper level students depending on the way it is set up and scaffolded. For an introductory course, the activity could be used repeatedly throughout the semester as individual graphs and questions as new knowledge is gained by the student. This could then lead to solving the entire problem by the end of the semester. For upper level courses such as a Physical Oceanography class, it might be a more stand-alone activity late in the semester, although students may still need to be reminded of some of the background knowledge required to piece the story together.
Teaching Notes
Learning Cycle Sequence
Check out the suggested sequence of activities for this Data Exploration.
For an overview of this activity and additional tips, you can also check out the webinar recording.
Students will need to be familiar with concepts from earlier in the semester including: wave properties, surface currents, barometric pressure, low pressure zones, and potential causes of these processes.
At any level, this activity requires synthesis of a variety of concepts that may not have been considered together previously. While the hope is to guide students to a more accurate scientific understanding, the broader learning goal is to make these connections.
Invitation: As an introductory activity, you can:
Consider doing one or more of the following to engage the students in the data activities to follow, to access their prior knowledge and make connections. These opportunities will also help to increase their interest in figuring out the interactions between the ocean and atmosphere that could cause an intense storm to develop.
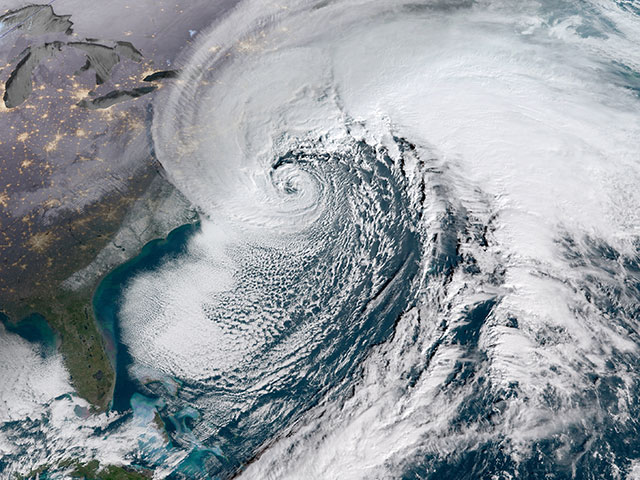
- Show a video with images (only) of the historic coastal storm (one can be found here)
- Tell students that this incredibly powerful storm hit the NE Coast in 2018, causing intense damage including snow, rain, huge waves, and flooding. Ask
- Did any of the students hear about the storm? What did they hear?
- Were any of them directly impacted by the storm? Encourage them to share their firsthand experiences.
- Ask students to do a turn and talk with their neighbor or small group (responding to a clicker question or classroom response system like polleverywhere.com) and briefly discuss the following prompts:
- What do you know about atmospheric processes and oceanographic conditions that might have come together to produce such a storm?
- What do you think the societal impacts were? Do you think that such a storm could be predicted with precision?
- What do you know about different types of storms (e.g. hurricanes, typhoons, nor'easters, bomb cyclones)? How are they different? The same?
- Brainstorm with students what concepts and ocean/atmosphere processes might be relevant in explaining the occurrence of the intense storm.
- Make a concept map about what they think causes huge coastal storms and include all the connections they can think of between atmosphere and ocean. Have students use pencil or paper or electronic or online tool if you are familiar with one (e.g. CMAP).
- Alternatively, rather than introducing the exercise by revealing that the phenomena to be studied are related to a large storm, you may wish to have the students examine the data and come to that conclusion on their own. In this case, the invitation may focus on the initial data that are presented, i.e. the wave data.
- Show videos or images of waves at sea, from calm seas with small waves to stormy seas with very large waves.
- Ask students to think about how quickly wave conditions can change at sea, and what could cause these rapid changes.
- Have students speculate on what it would be like to be on a ship at sea when wave conditions change dramatically. What would they do? Video of ships or boats being tossed around at sea may be useful to illustrate the power of ocean waves.
Exploration:
- Have the students examine the atmospheric and oceanographic data and summarize patterns they see. What could cause these patterns?
- Have students work in pairs or small groups to examine the plots. Ask them to describe the different aspects of the visualizations and patterns in the data they detect. Then ask what questions they think they might be able to answer with these data.
- Do the patterns they identify reveal something about the setting that their prior knowledge can help to explain?
- Having studied the data, is there anything they are wondering about that they might not yet be able to explain? What more information do they want or need?
- Alternatively, instructors may walk through the data as part of a larger discussion. The instructor could evaluate each data set with the students, before introducing the next topic: e.g. Now what would you expect surface current speed data to look like? Have students do a turn and talk or small group discussion about the prompts before turning to the whole group discussion. Then following the whole group discussion, display the current speed data and have students in small groups or partners discuss how the results compared to their prediction and what they learned from that. Repeat for each new variable that is introduced.
Concept Invention:
- Lead students in discussion of their answers after each data activity, calling on students to provide the evidence that led them to their conclusion.
- Have students identify the link between atmospheric and oceanic processes in a coastal area that may lead to coastal storms.
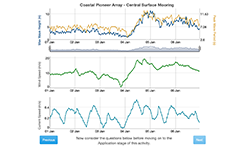
- Have students use the widget to examine and describe the relationship between wind speed, current speed, and wave height. Discuss correlations between these variables. Encourage students to describe the relationships, the evidence gathered from the data, and possible correlations with a partner or small group before leading a whole group discussion.
- Download the data and have students use the wave period data to calculate wavelength, wave speed, etc.
Application:
- Students now have the opportunity to investigate changes in atmospheric pressure and use what they've learned to hypothesize about what natural process is causing the collective air-sea changes they observed. Students support their hypothesis with evidence gathered from the various data widgets.
- Students are provided with barometric pressure data and asked to predict precipitation. Students respond to the prompt:
- How did you use the patterns you observed in the data to predict precipitation levels? After their prediction, students can compare to the actual precipitation data.
- Have students in small groups or partners discuss how the results compared to their prediction and what they learned from that.
- Show them an article from Penn State: The Historic Bomb Cyclone of January 2018.
- Show YouTube video of storm coverage from ABC news.
- Compare this episodic event to other bomb cyclones and to cyclones in general. Discuss the difference between tropical and extratropical cyclones.
- Consider the implications of extratropical cyclones on shoreline erosion.
Reflection: You could...
- Have students reflect on the entirety of the case with a question like: Although we often study separately the different pieces of the ocean system, this case study nicely shows the interaction of the atmosphere (wind), barometric pressure, and surface water properties (waves and currents). As you tied together all of these pieces you learned something new about the ocean. What did you learn?
- What concepts did you need to learn more about in order to figure out what air-sea interactions may have resulted in the Bomb Cyclone?
- What new connections between concepts did you make?
- In what ways did these connections help you to understand the concepts better?
- What was the most difficult part of this activity/unit/challenge for you? Why? What helped you to figure it out?
Subject / Topics
- Sea state, surface waves, atmospheric pressure, cyclones
- Graph interpretation
This exercise could be used to ask students to link previously learned concepts, such as formation of hurricanes and other cyclonic storms to high-resolution sea surface monitoring data. If these topics have not yet been covered, this example can provide the impetus to learn about them. It requires taking information in one form, mostly graphs, and conceptualizing about extratropical cyclones on the New England continental shelf. In introductory classes, instructors may want to have students grapple with one or a couple of the concepts and fill in the details for them on the rest.
In more advanced classes students should be challenged to recall previously learned information and apply it to this problem. Instructors should be ready to jog their memories about the learned information.
Grade Level
Undergraduate students in Introductory Oceanography courses (for either marine science majors or non-science majors)
This exercise can be a case study in upper level Physical Oceanography courses, where students apply what they have learned about extratropical cyclones and the transfer of energy between the atmosphere and ocean.
Data Scope
Our scope in exploring ways to use professionally-collected data in our teaching:
- Using professionally-collected data in teaching of concepts
- Visualizing data in a user-friendly and authentic way
- Enabling students to interactively engage with data in their learning, to see the patterns as they are learning, and understanding the causes of those patterns
Quantitative Skills
Most of the quantitative reasoning in this exercise revolves around reading and interpreting graphs.
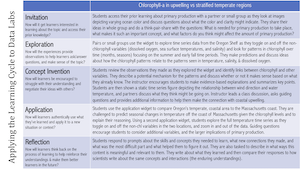
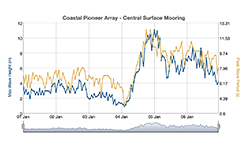
- Sea state is determined by interpreting a graph of wave heights and wave periods. Students are asked to read the graph to identify a period of exceptionally high wave energy.
- Wind speed is presented in a graph and students must make the connection between the magnitude of the wind and the size of waves and speed of surface currents.
- Students must examine a graph showing atmospheric pressure to understand that extreme low pressure systems are associated with increased wind speed, with resultant effects on surface water motion.
- Students use their understanding of barometric pressure and resulting oceanic conditions to predict the relative precipitation increase that occurs during a low pressure system.
- They must also articulate patterns in the data presented.
- With the help of the widget students will examine time series of atmospheric pressure, wind speed, wave properties, current speed, and precipitation. They should see that there is a strong correlation between all five of these variables.
Science Explanation
TBD