Dynamic Air-Sea Interactions Concept Invention
Your Objective
Your objective for this activity is to examine how atmospheric processes affect surface oceanographic conditions. In this section, you will link the wave data from the previous activity to wind and current data, to investigate the interaction between the oceans and atmosphere.
Data Tips
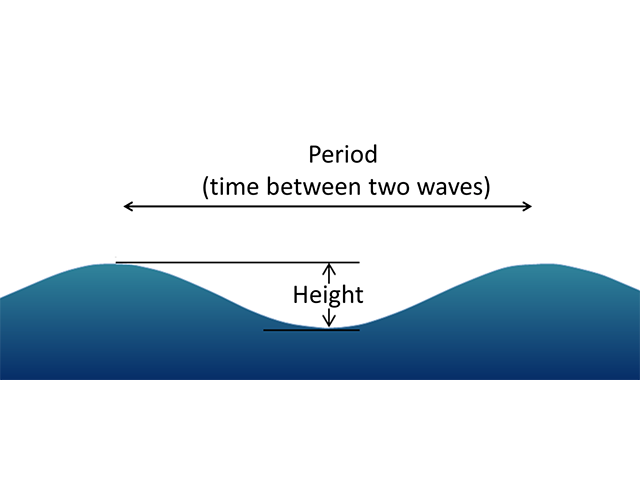
- When the site loads you are able to see maximum wave height and peak wave period data from the Coastal Pioneer Central and Surface Moorings.
- Move your cursor over the plots to reveal the values for each data point.
- Zoom in and out by dragging the slider bars to select the time period of interest.
- You can interact with the data by clicking on the "Next" button to display additional data sets.
Questions for Thought
- Click through and examine each data set one at a time: wave height, wave period, wind speed, and surface current speed, and explore how they change through time. What patterns do you see for each individual data set over the course of a week?
- Compare the datasets and describe any correlations you see among the datasets.
- What effect does wind speed have on waves and surface currents?
- The current speed data show significant fluctuations throughout the sample period. What could be causing these daily fluctuations?
- What natural process may have been responsible for the collective air-sea changes you observed?
Background Information
Click on the images below to learn more about where and how the dataset above was collected.
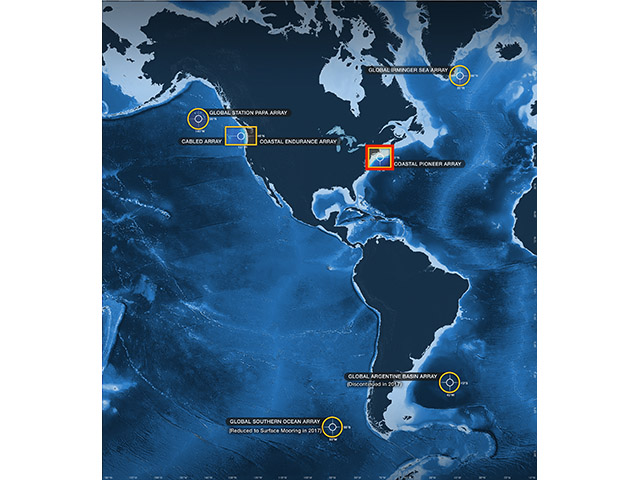
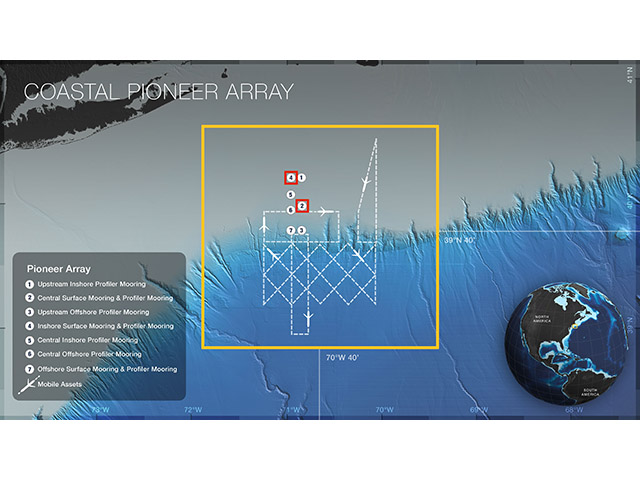
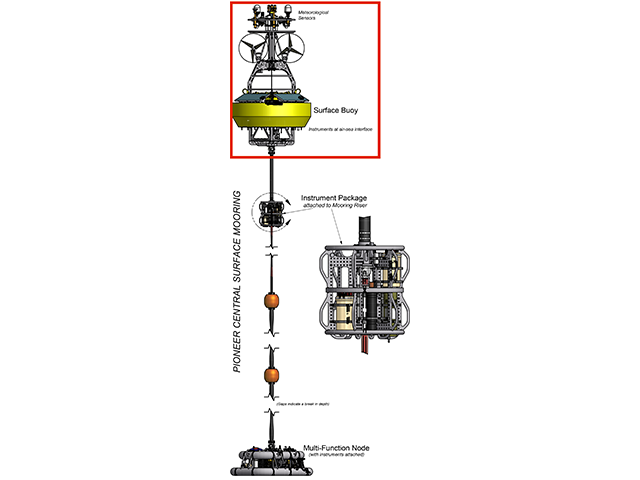
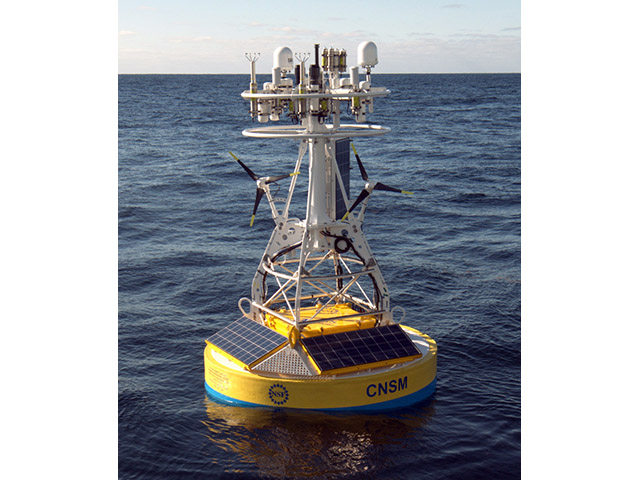
Dataset Information
The data for this activity was obtained from the following Coastal Pioneer instruments:
- Central Surface Mooring, Surface Wave Spectra (CP01CNSM-SBD12-05-WAVSSA000)
- Central Surface Mooring, Bulk Meteorology Instrument Package (CP01CNSM-SBD11-06-METBKA000)
Recovered datasets were downloaded from the OOI data portal, and then hourly mean averages were calculated and merged together into a single file for use in this activity. Hourly rain rate was calculated by differencing the hourly precipitation measurements.
See this Jupyter Notebook for details on how the data for this activity was processed.
Activity Citation: Degan, J., Hicks, M., Mitra, S., Webb, P., & Lichtenwalner, C. S. (2019). Dynamic Air-Sea Interactions. OOI Data Labs Collection.