Dynamic Air-Sea Interactions Exploration
Your Objective
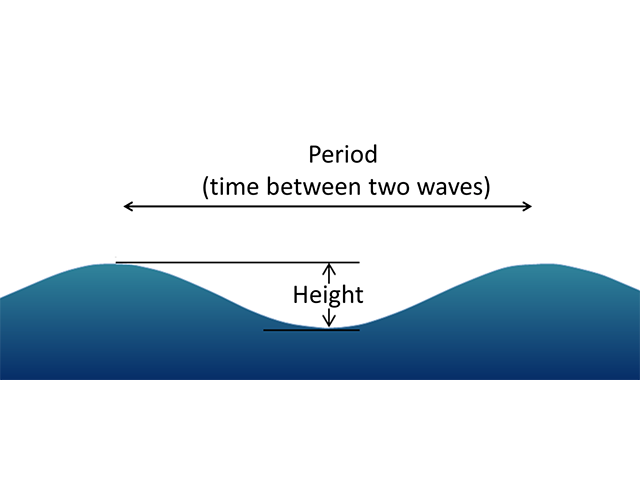
Your objective for this activity is to examine how atmospheric processes affect surface oceanographic conditions. In this section, you will analyze the relationship between wave height and wave period, and speculate on the processes that can influence wave properties.
Data Tips
- When the site loads you are able to see maximum wave height and peak wave period data from the Coastal Pioneer Central and Surface Moorings.
- Move your cursor over the plots to reveal the values for each data point.
- Zoom in and out by dragging the slider bars to select the time period of interest.
Questions for Thought
- Across what time period are you able to see wave data in this graph?
- What are the minima and maxima of these variables?
- Do the minimum values of each variable occur at around the same time? What about the maximum values?
- What is the relationship between wave height and wave period?
- Do the maximum values of each variable seem anomalous (unusual) compared to the rest of the data?
- Hypothesize some factors that could lead to the changes in wave properties that you observed.
Background Information
Click on the images below to learn more about where and how the dataset above was collected.
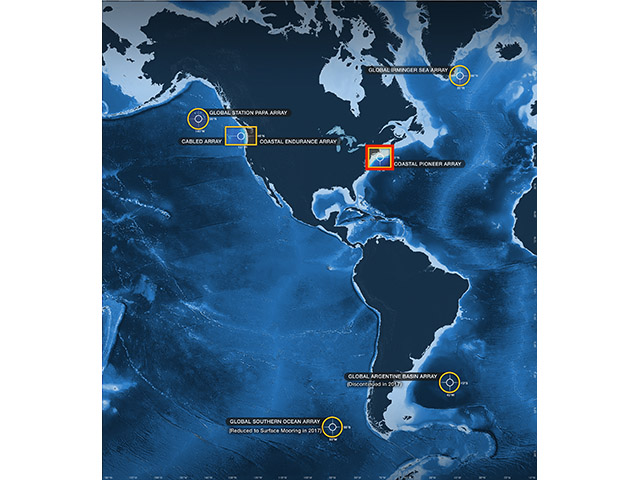
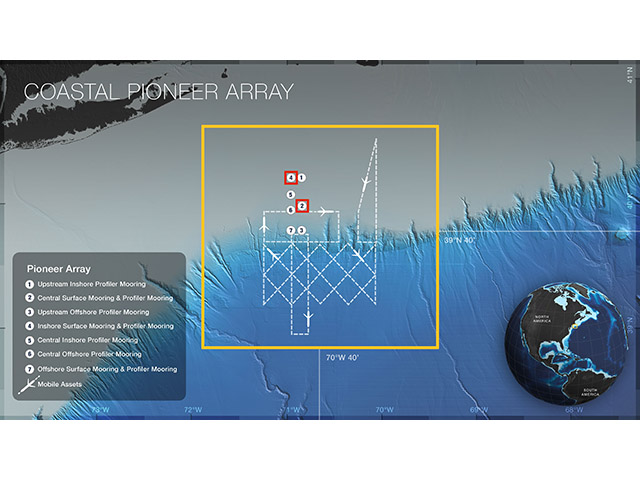
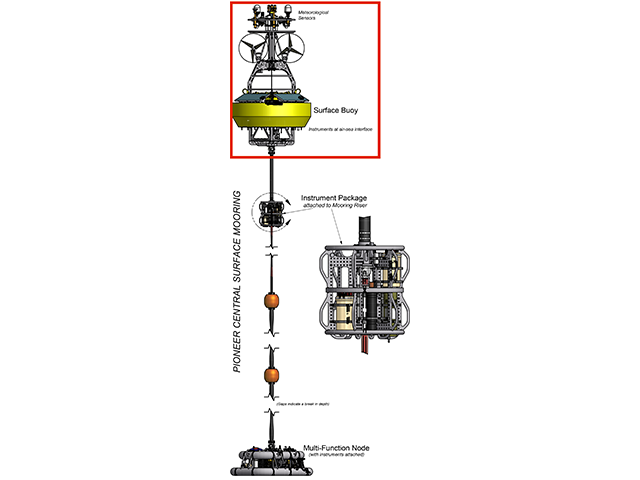
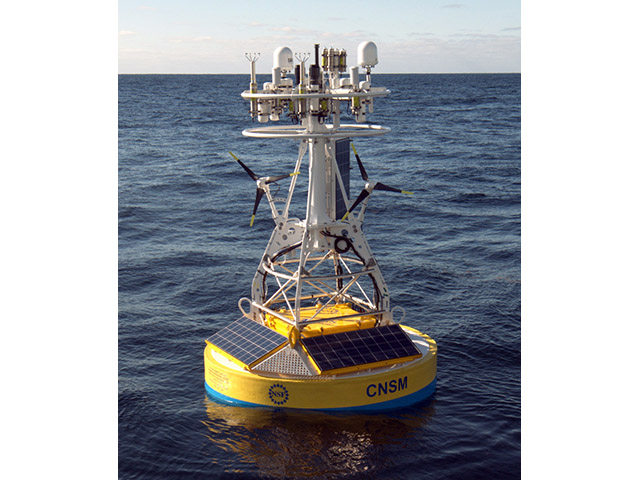
Dataset Information
The data for this activity was obtained from the following Coastal Pioneer instruments:
Recovered datasets were downloaded from the OOI data portal, and then hourly mean averages were calculated and merged together into a single file for use in this activity. Hourly rain rate was calculated by differencing the hourly precipitation measurements.
See this Jupyter Notebook for details on how the data for this activity was processed.
Activity Citation: Degan, J., Hicks, M., Mitra, S., Webb, P., & Lichtenwalner, C. S. (2019). Dynamic Air-Sea Interactions. OOI Data Labs Collection.