Dynamic Air-Sea Interactions Application
Your Objective
Your objective for this activity is to examine how atmospheric processes affect surface oceanographic conditions. In this section, you will link the data from the previous activities to atmospheric pressure, and make some predictions about rainfall.
Take a look at the above charts. Use your mouse to draw your prediction for what the rest of the Rain dataset should look like. After you have made your estimate, click the "Check Prediction" box.
Data Tips
When the site loads you are able to view the previous graphs displaying maximum wave height, peak wave period, wind speed, and surface current speed data from the Coastal Pioneer Central and Surface Moorings. You will also see a new figure showing barometric pressure and precipitation during the same time period. The precipitation data are incomplete. You can interact with the data by:
- Moving your cursor over the plots to reveal the values for each data point.
- Using your cursor to make a prediction of what the precipitation data would look like during this event.
- You can then click on the "Next" button to display the actual precipitation data and check your prediction.
Questions for Thought
- Describe changes in atmospheric pressure over the course of the week.
- How do changes in atmospheric pressure correlate with the other variables?
- With the additional data, what natural process do you hypothesize is responsible for the collective air-sea changes you observed?
- How did you use those changes or patterns to help make your prediction of precipitation levels? What is your evidence?
- If you lived in a coastal area of the northeast of the US, how might this event affect your life?
- What questions do you still have about dynamic air-sea interactions?
Background Information
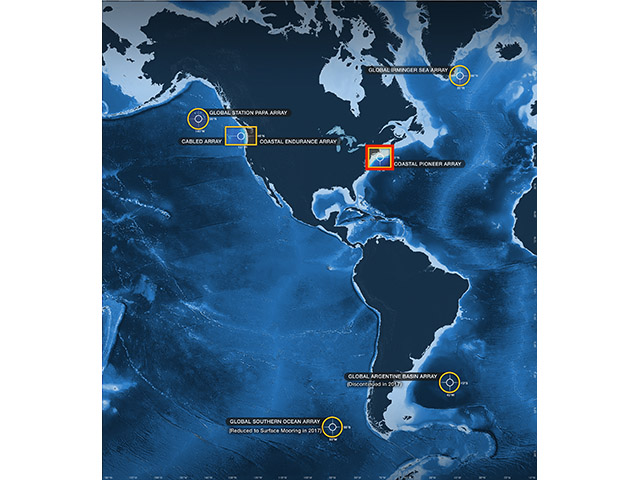
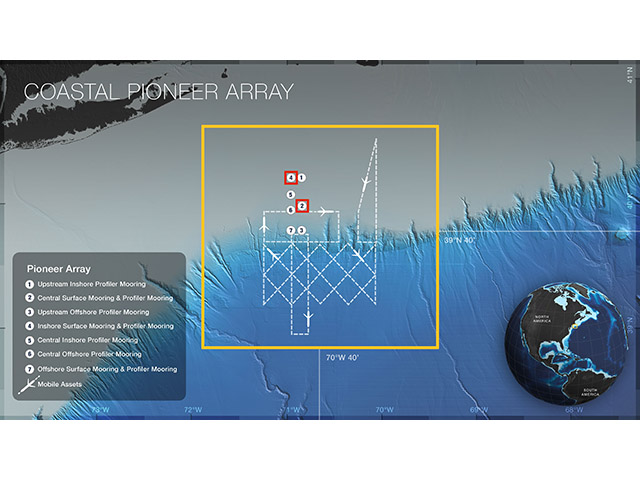
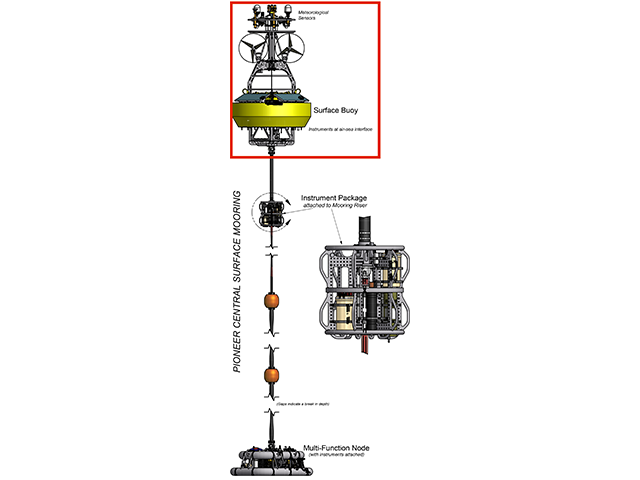
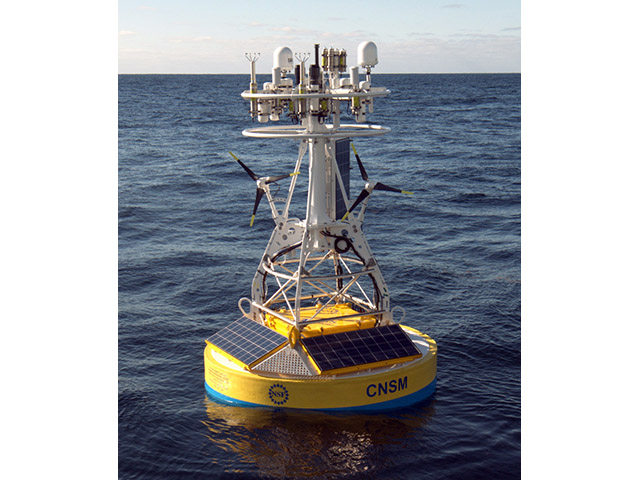
Click on the images below to learn more about where and how the dataset above was collected.
Dataset Information
The data for this activity was obtained from the following Coastal Pioneer instruments:
- Central Surface Mooring, Surface Wave Spectra (CP01CNSM-SBD12-05-WAVSSA000)
- Central Surface Mooring, Bulk Meteorology Instrument Package (CP01CNSM-SBD11-06-METBKA000)
Recovered datasets were downloaded from the OOI data portal, and then hourly mean averages were calculated and merged together into a single file for use in this activity. Hourly rain rate was calculated by differencing the hourly precipitation measurements.
See this Jupyter Notebook for details on how the data for this activity was processed.
Activity Citation: Degan, J., Hicks, M., Mitra, S., Webb, P., & Lichtenwalner, C. S. (2019). Dynamic Air-Sea Interactions. OOI Data Labs Collection.
