Seasonal Variability In The Mixed Layer - Instructor's Guide
Published October 19, 2020
Summary
This exercise is designed to facilitate learning about surface mixing in the ocean. Pieces of the exercise can be used as appropriate for the instructor goals. The collection consists of 3 sets of activities. Part One is focused on data exploration activities, to be used during the Exploration phase of the Learning Cycle. Part Two is focused on the Concept Invention phase of the Learning Cycle. Part Three is focused on the Application phase of the Learning Cycle.
These activities were developed to assist with students' understanding of mixed layer dynamics, in part because surface ocean dynamics are foundational in Oceanography and cut across numerous Ocean Literacy principles, and also because wind-driven surface mixing in particular is widespread, easily observed in a variety of systems and with tractable dynamics that make it suitable for introductory oceanography instruction. We have also focused the data lab on a location distant from the coast, and specifically on temperature variations that are driven by mechanical surface mixing (due to wind) and solar irradiance. The influence of salinity on mixed layer dynamics (due to buoyancy) is not considered.
The Exploration phase introduces students to time-series data and allows for the interpretation of data patterns, focusing on wind, solar irradiation and water temperature at a single station in the North Atlantic Ocean. The Concept Invention phase helps students to come to a deeper understanding of the interaction of wind and solar irradiance and the consequences for water temperature at different depths. There are two Application phase experiences: Application #1 asks students to consider the same atmospheric data types and predict the resulting water temperature patterns for a location in the North Pacific. The use of a different location prompts the student to find patterns and make connections between the various parameters. Application #2 asks the students to connect the physical processes that they've explored in the Exploration and Concept Invention phase to primary production.
This data exploration takes students from a very basic introduction to time-series data, through more complex examinations of ocean/atmospheric connections, and eventually application of the conceptual model they have developed at other locations, and to other processes.
Learning Goals
Students who complete this unit will be able to:
- Read time-series and depth profile plots and communicate that information in words
- Make observations of the seasonal (and interanual) variability of stratification at one location
- Describe patterns in individual data sets and correlations between the different data types presented
- Describe how atmospheric processes mix surface water and alter thermal structure of the sub-polar North Atlantic Ocean
- Generate hypotheses about how physical mixed layer processes influence biological productivity
- Apply mechanistic understanding gained at one location to a new location
We believe that this data lab also supports two ocean literacy principles, which we interpret as being enduring understanding benchmarks for students':
- Ocean Literacy Principle 1: The Earth has one big ocean with many features, and in particular: Throughout the ocean there is one interconnected circulation system powered by wind, tides, the force of the Earth's rotation (Coriolis effect), the Sun, and water density differences. The shape of ocean basins and adjacent land masses influence the path of circulation. This "global ocean conveyor belt" moves water throughout all of the ocean's basins, transporting energy (heat), matter, and organisms around the ocean. Changes in ocean circulation have a large impact on the climate and cause changes in ecosystems.
- Ocean Literacy Principle 3: The ocean is a major influence on weather and climate.
Ultimately, the enduring understanding from this exploration is that the ocean is dynamic, and processes are interconnected and tractable, and these processes that we can investigate at a particular location roll-up into global scale climate controls and productivity controls.
Context for Use
This data exploration was designed for use in an introductory oceanography course (majors and/or non-majors). These activities provide an opportunity for students to practice reading graphs, making observations and interpretations of data and examine foundational concepts of seawater properties and their controls. This particular topic is also useful as an introduction for students to the interaction of various processes, for example this may set the stage for discussion of deepwater formation and thermohaline circulation, phytoplankton blooms or carbon cycling.
Teaching Notes
Learning Cycle Sequence
Check out the suggested sequence of activities for this Data Exploration.
For an overview of this activity and additional tips, you can also check out the webinar recording.
Students may benefit from familiarity with ancillary concepts, notably:
- The processes that lead to variation in density in ocean water (perhaps using the Drivers of Seawater Density Data Exploration,
- patterns and controls on productivity in the ocean (perhaps using a Data Exploration from the Productivity collection),
- and patterns and processes of heat fluxes between the atmosphere and surface ocean (this animation from NASA Earth Observatory might be useful).
This activity requests that students consider the relative influence of a variety of processes on different depths in the water column. While the hope is to guide students to the correct understanding of mixed layer dynamics, there is also benefit associated with conceptually understanding this interaction of processes.
Worksheets
The following worksheets can be used to assist students in these activities.
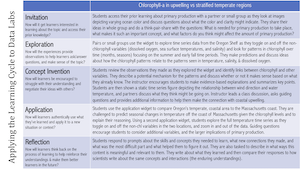
Invitation: As an introductory activity, you can:
- Show images such as: a school of fish with a sea lion swimming through the school capturing fish, or a humpback whale bubble netting and shooting up through a swarm of krill to emphasize that most of the productivity in the ocean occurs in the very surface layer of the ocean, and the dynamics there are important to understand.
- Show a clip of high sea state in the North Atlantic to raise interest in the investigation.
- Show or demonstrate in class the influence of mechanical wind mixing (youtube video) and encourage students to think about how mixing is most efficient in the mixed layer, since its density is uniform with depth.
- Show an animation of Chl in the N. Atl (option #1,, option #2, or an annual chlorophyll surface map of the globe, to show how productive the North Atlantic is on a seasonal basis, and pose the question, "Why is that?"
Exploration:
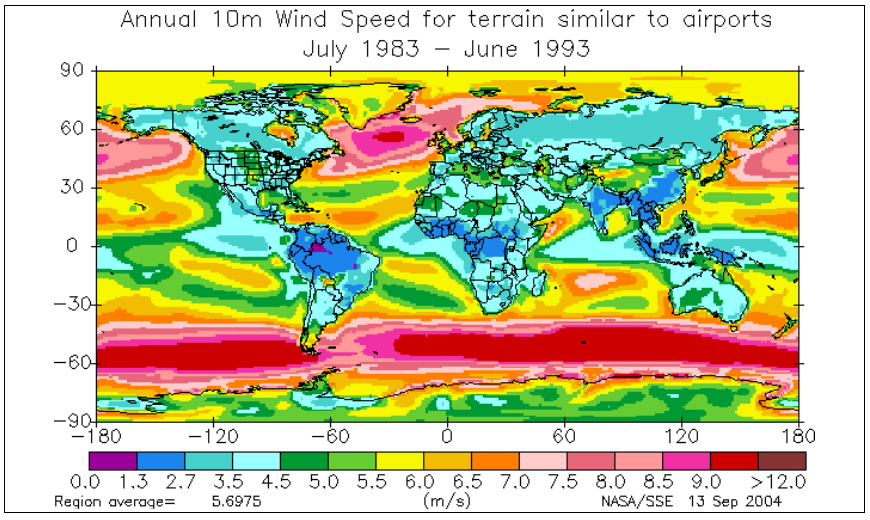
- Have the students examine a map of the data collection locations at the Irminger array. Talk through some of the special considerations about this location - latitude, proximity to Greenland, overall climate, etc. For example, something like this wind speed picture, to emphasize how unique the wind climate is at this location might be useful.
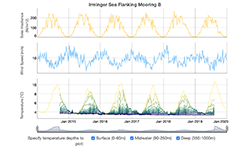
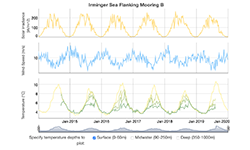
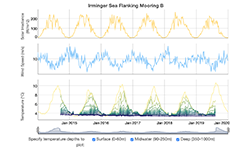
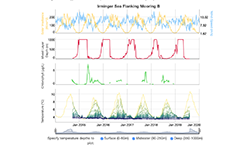
- Have the students examine stacked wind observations and solar irradiation data for the Irminger array, and in particular guide them towards recognizing the clear seasonal pattern by paying attention to the time labels on the x-axis.
- Have the students examine a stacked set of temperature time-series from different depths at the Irminger array. Emphasize to them that it is important to pay attention to, and think about, the depths at which these sensors are collected. Possible reference the mooring schematic.
- Encourage the students to turn off and on temperature time-series for different depths, to try to figure out how different combinations of wind forcing and solar forcing lead to changes in temperature at different depths.
- Students should describe how the temperature, wind and irradiance observations relate to each other.
- Is there anything they are wondering about having studied the data that they might not yet be able to explain? What more information do they want or need?
Concept Invention:
This phase of the investigation asks students to dive more deeply into the same data used in the Exploration, but with different questions.
- Have students consider whether the patterns they identify reveal something about the mixed layer dynamics throughout the season? Overall stratification of the water column?
- You could choose to have students draw a depth profile of temperature for a representative winter month and a summer month, thus practicing translating the time-series of temperature at all depths to a snap-shot of stratification at two time points. This might help students understand and interpret the data and also how to read depth profiles. Do this before revealing the feature that allows them to scroll the time series and see the accompanying depth profile in the widget.
- Encourage students to actually extract a mixed layer depth for a representative time period (weekly or monthly) and plot it as a time-series.
- Have students summarize the relationship between wind and irradiance and mixed layer depth. This could be communicated in words or in a conceptual diagram of the mixing processes. Encourage students to cite evidence from the visualization and to elaborate and clarify their understanding of the relationship.
- Encourage the students to make (i.e. draw) or verbally describe a conceptual model to a partner regarding the interaction of wind and solar irradiance and its consequences for water temperature at different depths. If possible, the instructor could then ask guiding questions and encourage them to support their model with evidence from the visualization.
- One possible resource for visualizing complex systems is Loopy. Below is one version based on this exercise. These concept maps can be made by students or provided to students for them to play with and explore.
Application:
Application #1
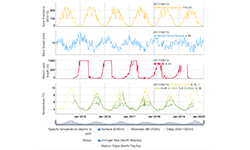
- The overall idea behind this step is to encourage students to examine a wind/solar irradiance time-series from a different location (Station Papa in the North Pacific Ocean), and make predictions about temperature patterns at different depths based on what they've learned from the North Atlantic.
- Use the widget to examine and describe the relationship between wind speed and solar irradiance at this site. Discuss correlations between these variables, and in particular if there are any notable differences between the patterns here and at the Irminger Array.
- Encourage students to apply their conceptual model developed in the concept invention phase to predict temperature patterns.
- Students then turn on and off temperature time-series at different locations to test their prediction.
- You could prompt students to think about deepwater formation and thermohaline circulation as it relates to full water column mixing in winter at Irminger but not Papa.
- As an extension, you could also choose to have students discuss similar data from the Southern Ocean Array published in Ogle et al, 2018
Application #2
- In the application step students will be asked to combine insights from this activity, and background information on primary production controls (top-down, bottom-up etc.)
- Remind students for this step that the deep ocean serves as a reservoir of nutrients, and mixing can bring those nutrients into the well-lit eutrophic zone
- A short introduction/or summary of an ocean productivity conceptual model may be useful here
- Students examine a time-series of chla-concentration from the Irminger Sea, paying careful attention to when in the year productivity is high
- If nutrients data are available they could be added here
- Students then examine the time-series first introduced in the exploration segment (wind, solar irradiance and water temperature time-series, paying careful attention to seasonal patterns
- Students are then asked to integrate primary production into their conceptual model - how might primary production at this site be controlled by the physical interaction of wind and solar irradiance and their interaction with the surface of the ocean?
Possible Application #3
- The Thermohaline Circulation activity (in development by a June group) asks students to focus their attention on the winter mixing. If not yet previously discussed, students could complete that exploration at this time to more explicitly consider deep water formation.
Reflection:
- Have students reflect on the entirety of the case with a question like: Although we often study separately the different pieces of the ocean system, this case study nicely shows the interaction of the atmosphere (wind), and external forcing (solar energy) with water properties (temperature). As you tied together all of these pieces you learned something new about the ocean. What did you learn?
- Ask the students to consider how they learned and how much they learned and applied their learning through one or more of the following:
- What new skills did you learn that helped you to develop a conceptual understanding of mixing in the surface ocean?
- We focused on the implications of mixing for temperature, but what other constituents might be mixed in the surface ocean?
- What concepts did you need to learn more about?
- What new connections between concepts did you make?
- In what ways did these connections help you to understand the concepts better?
- What was the most difficult part of this activity/unit/challenge for you? Why? What helped you to figure it out?
Subject / Topics
Introduction to Oceanography
Grade Level
Undergraduate students in Introduction to Oceanography courses (for either marine science majors or non-science majors). Could be extended for upper level students.
Data Scope
Our scope in exploring ways to use professionally-collected data in our teaching by:
- Using professionally-collected data in teaching of concepts
- Visualizing data in a user-friendly and authentic way
- Enabling students to interactively engage with data in their learning to see the patterns as they are learning the why
Quantitative Skills
Most of the quantitative reasoning in this exercise revolves around reading and interpreting graphs.
- Students must articulate the seasonal pattern in the data presented by paying careful attention to the time (y-) axes.
- Students must compare parameters across sites, which requires them to consider ranges in different data patterns
- With the help of the widget students will examine time series of ocean temperature, solar irradiance and wind speed. They should see that there is a strong correlation among all three of these variables.
- Students will be able to interpret time-series of water temperature in order to identify and quantify a secondary parameter - mixed layer depth, and compare that derived parameter over time.
Science Explanation
TBD