Seasonal Variability In The Mixed Layer Application
Your Objective
Below are solar irradiance, wind speed and water temperature data from the surface ocean in the North Atlantic Ocean. Apply what you have learned about stratification and the mixed layer from the North Atlantic Ocean to another location. Toggle on the same data sets collected in the North Pacific Ocean to identify patterns and gain insights about the interaction of various processes:
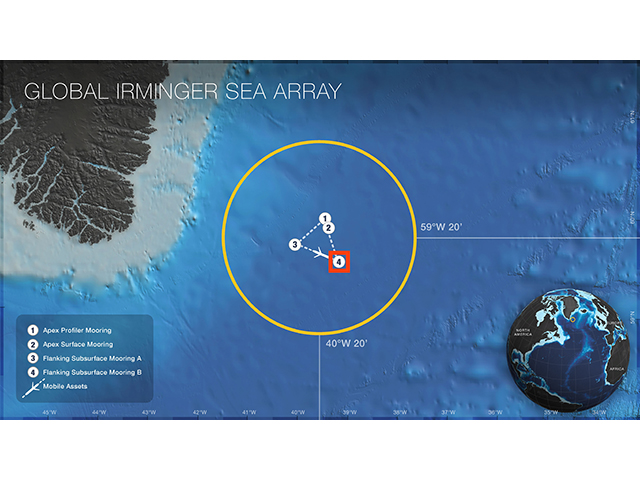
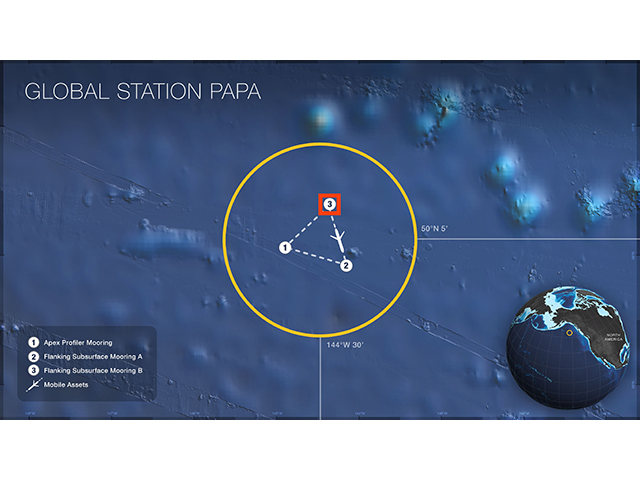
- Investigate seasonal wind and solar irradiance patterns from Ocean Station Papa in the North Pacific Ocean. This station is in a different ocean basin, AND sits at a latitude that is 10 degrees south of the Irminger Array.
- Make predictions about how the interaction of surface ocean processes (wind and solar radiation) will affect the temperature of the ocean at various depths.
Specify temperature depths to plot:
Show:
Data Tips
The plots above show wind, solar radiation and water temperature (at various depths) data for a multi-year period from the Ocean Papa Array in the North Pacific Ocean, together with the same data types from the Irminger Sea Array in the North Atlantic Ocean. Specifically we are using surface meteorological data from the ECMWF reanalysis model, and CTD data from Flanking Mooring B. You can interact with these data by:
- Turning on and off water temperature time-series from different depths (surface, mid, deep)
- Zooming in and out of the data to look at different time scales that interest you by changing the width of the highlighted section of the bottom graph
- Hovering over data points to show data values for a specific time
- Hovering over the temperature timeseries to show the corresponding depth profile plot to the right.
Questions for Thought
- What oceanic or atmospheric variables can you investigate in these graphs?
- Which of the variables shown here were collected in the ocean?
- When was the data first collected and when was the data last collected? Give these answers in month and year.
- What is the overall range of wind speeds at this site? In the winter? In the summer? How about the range for solar irradiation?
- How do the range of values for the parameters measured at Station Papa differ from the Irminger Sea?
- What patterns do you observe for wind and solar irradiance at Station Papa?
- How does temperature vary over time? How does temperature vary with depth? Are the patterns that you observe here consistent with your conceptual model?
- Is the water column at Station Papa stratified in the upper 1000 m for the full year? What about at the Irminger Array?
- How do the differences in stratification at the two stations relate to differences in the atmospheric forcing?
Background Information
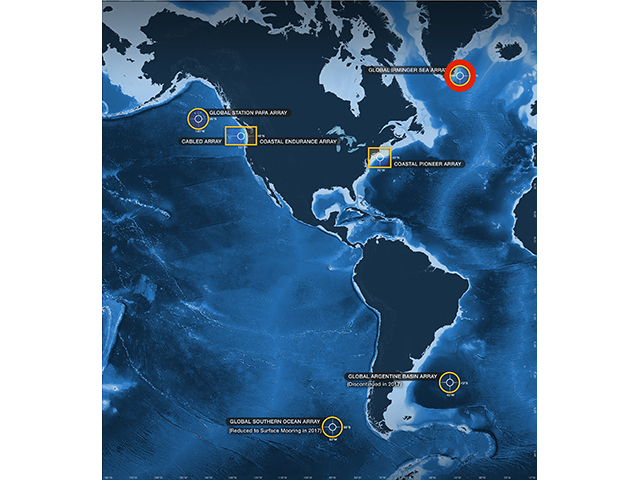
Click on the images below to learn more about where and how the dataset above was collected.
What is stratification?
What is solar irradiance?
What is the Mixed Layer Depth (MLD)?
This is the depth of mixing in the surface ocean that results in a uniform temperature as you move down in the water column from the surface. The mixed layer depth can be identified by looking for the depth range of the surface ocean where temperature is relatively constant (above the thermocline). This constant temperature indicates active mixing processes are at work.
The MLD is determined by physical processes such as wind and water density (controlled by temperature and salinity). At this site the major driver of variations in water density are the large temperature variations that happen between winter and summer temperature during the winter months, while a combination of salinity and temperature drive water density during the summer months.
For this data lab we are viewing these mixed layer dynamics as being a fairly simple function of mechanical wind mixing and energy transfer at the surface (we ignore the impact of salinity). There are other factors, but we are keeping it simple.
Dataset Information
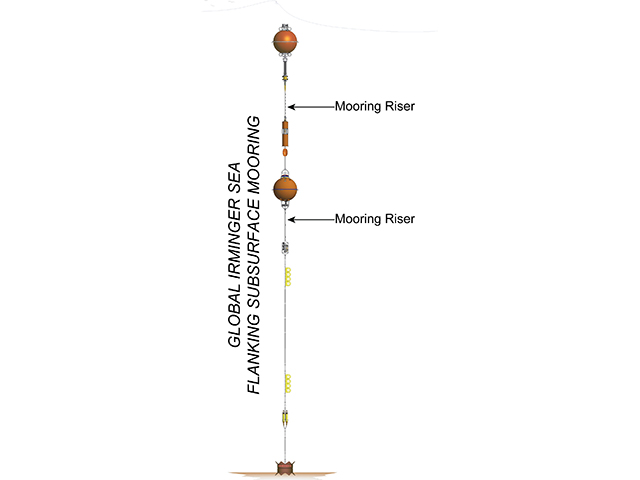
The CTD data for this activity was obtained from the instruments deployed at Irminger Sea Flanking Mooring B and Station Papa Flanking Mooring B.
Because the timeseries for the global Surface Moorings at each array is rather gappy, due to harsh weather conditions and instrument failures, we used the ERA5 Reanalysis Model from ECMWF to provide sea surface temperatures (0m), wind speed and irradiance data for each mooring.
Recovered datasets for each CTD (from 30m to 1,000m) were downloaded from the OOI data portal, cleaned, and then daily (mean) averaged, before being combined with the model reanalysis dataset and averaged again into weekly values in order to showcase seasonal cycles instead of daily variabilty.
To calculate the estimated Mixed-Layer Depth for each time step, we interpolated the measured temperature profile and then found the depth that was 0.5°C less than the surface temperature.
See this Jupyter Notebook for details on how the data for this activity was processed.
Activity Citation: Eveleth, R., Lemkau, K., Miller, I., Smith, S., & Lichtenwalner, C. S. (2020). Seasonal Variability In The Mixed Layer. OOI Data Labs Collection.