Chlorophyll-a in upwelling vs. stratified temperate regions - Instructor's Guide
Published December 11, 2019
Summary
Time series data is utilized to connect lecture discussion on ocean currents, upwelling/downwelling, seasonal variability, ocean chemistry, and productivity. Students are given the opportunity to explore these learning outcomes and to draw their own predictions on the graphs and view if their predictions resemble the observed data. Students contrast and compare selected time series data from the Coastal Endurance (Pacific Ocean) and Coastal Pioneer (Atlantic Ocean) Array and determine if the data follows predicted patterns. They examine the Array time series data and identify time frames where the data follow expected trends and make predictions about these time frames. This exercise is a case study that, if used in full, takes students through the entire learning cycle from invitation to reflection as applied to continental margins in temperate environments that either do or do not experience seasonal upwelling. Pieces of the exercise can be used as appropriate to meet instructor goals.
- Students access their previous learning on primary production through images depicting varying ocean color (Invitation). (See Teaching Notes below for concepts your students should be familiar with before starting this exercise.)
- Some time series data from the Oregon Shelf are presented and students are asked to speculate on the relationships between variables. (Exploration)
- Students are asked to describe a potential mechanism for the relationships. Afterward, they are shown figures of coastal upwelling and the relationship of winds with temperature off Oregon. (Concept Invention)
- After learning about upwelling, students are challenged to apply what they have learned to a time series from the Massachusetts coast during seasonal stratification. (Application)
- Students are asked to reflect on the interaction between wind, water properties, and biology, and about what they have learned about this complexity. (Reflection)
Enduring Understandings
Students should ultimately understand that:
- Increases in dissolved oxygen are a consequence, not a cause of primary productivity.
- Density stratification works to separate phytoplankton from the two things they need for primary productivity: light and nutrients.
Learning Goals and Assessments
After engaging with the Data Exploration a student will be able to:
- Interpret basic time-series data visualizations and identify patterns and anomalies.
- Compare time-series sea surface temperature, salinity, dissolved oxygen, and chlorophyll data at a Pacific Ocean coastal site and Atlantic Ocean coastal site over time to explore the data for changes and patterns both temporally and spatially.
- Discuss the role of water chemistry (dissolved oxygen, temperature, and salinity) on the amount of phytoplankton. [The amount of chlorophyll is heightened at times of cooler temperatures and higher salinities.]
- Mechanistically explain the relationship between sea surface temperature, salinity, dissolved oxygen, and chlorophyll during late summer - early fall at a Pacific Ocean coastal site and Atlantic Ocean coastal site.
- Explain the driving mechanism and relationship between primary productivity and temperature. [Temperature influences density and thus stratification.]
- Explain the role of upwelling/downwelling, longshore transport, and density stratification on phytoplankton abundance.
- Describe the importance of proxy data and predict phytoplankton concentrations using proxy data as a tool.
Context for Use
These data explorations were designed for implementation in an introductory oceanography course (majors and/or non-majors). These activities would be appropriate for exercises in reading and interpreting graphical data as well as examining the processes that affect primary production, focusing on spatiotemporal variations such as the spring bloom in temperate environments and the high productivity of upwelling regions.
Teaching Notes
Learning Cycle Sequence
Check out the suggested sequence of activities for this Data Exploration.
For an overview of this activity and additional tips, you can also check out the webinar recording.
Students will need to be familiar with concepts from earlier in the semester including: density stratification; the vertical distribution of oxygen, carbon dioxide, and nutrients, and what affects them; Ekman Transport and upwelling.
At any level, this activity requires synthesis of a variety of concepts that may not have been considered together previously. While the hope is to guide students to a more scientifically accurate understanding, the broader learning goal is in making these connections.
The Data Exploration activities require access to an internet-ready computer or tablet. Ideally each student or pairs of students would have a computer or tablet to use to engage with the activity. Alternatively, if no internet access is available for each student or pairs of students, graphs of the specific time periods of interest and variables could be printed onto plastic overlays for each student or group of students. Note, the Data Explorations use authentic raw data. Many of the datasets have been downsampled for simplicity and to ensure that the interactives load quickly in your browser.
Invitation
- Display pictures/images/slides/video clips of ocean areas showing different colors of ocean water. As each image is shown, ask students to turn to the person next to them and share how they would describe the color and clarity of the water. After the last image is shown, ask students to turn to the students next to them and discuss the following questions:
- If you've been to the ocean yourself, how would you describe the color and turbidity of the water there? What else did you notice about that ocean environment?
- Are you surprised by the various colors and turbidity of ocean water? Why or why not?
- What do you think might cause the water to be such different colors and turbidity?
- Which color of ocean water do you perceive as being cleaner? Which do you think is more full of life? Would you expect to find more life in warmer or colder water? For each, describe what makes you think that.
- Lead a whole group discussion, asking students to share some of the ideas that came up in their small group discussions. Depending on what they share, and if students need more prompting to make connections to their prior knowledge and experiences, remind them that water color is a good indicator of primary production because phytoplankton have a pigment called chlorophyll that appears green, whereas unproductive areas are clear and/or blue.
- Ask students to think back to what they learned about primary production and do a Think Pair Share with the following prompts:
- What is needed for primary production to take place and what makes primary production such an important concept to understand and measure?
- What environmental/oceanic factors do you think might affect the amount of primary production?
- Depending on what students share, provide a summary of the importance of phytoplankton on a global scale including its role on marine fisheries, carbon dioxide levels, and climate science.
Exploration
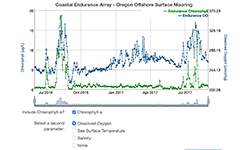
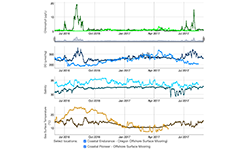
- Students use the widget to interactively toggle on and off the non-chl variables (dissolved oxygen, sea surface temperatures, and salinity), as well as zoom in and out of the data to explore it more.
- Students engage with the data to identify patterns in chlorophyll over time (months, seasons) focusing on the summer and early fall time periods in each of the years off the Oregon coast. Optional: students provided with a map of the Oregon coast study site to provide context.
- Students make predictions and discuss ideas about how the chlorophyll patterns relate to the patterns seen in temperature, salinity, and dissolved oxygen over the same time period.
- Other extended activities for students to explore might include:
- Students use google earth/ocean to locate the Array sites and continental shelf in proximity to the Array sites.
- Students use bathymetry to explore its role in upwelling events.
- Students use earth null school or NOAA sites to explore the role of warm water eddies.
Concept Invention
- Have students identify the links between chlorophyll and water temperature, salinity, and dissolved oxygen, and decide whether or not it makes sense. Students review the evidence they gathered as they explored the data to generate and support their explanations. Instructor may decide to lead a whole group discussion to encourage students to make evidence-based explanations and to summarize key points.
- Optional: You may want to have students also explore a graphical representation of static data to draw conclusions between chlorophyll and water chemistry.
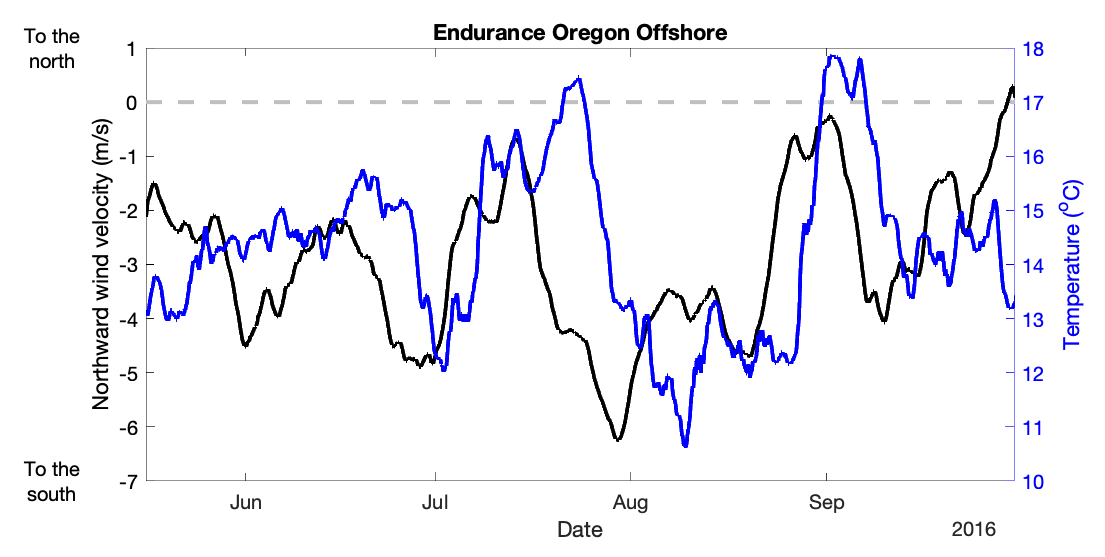
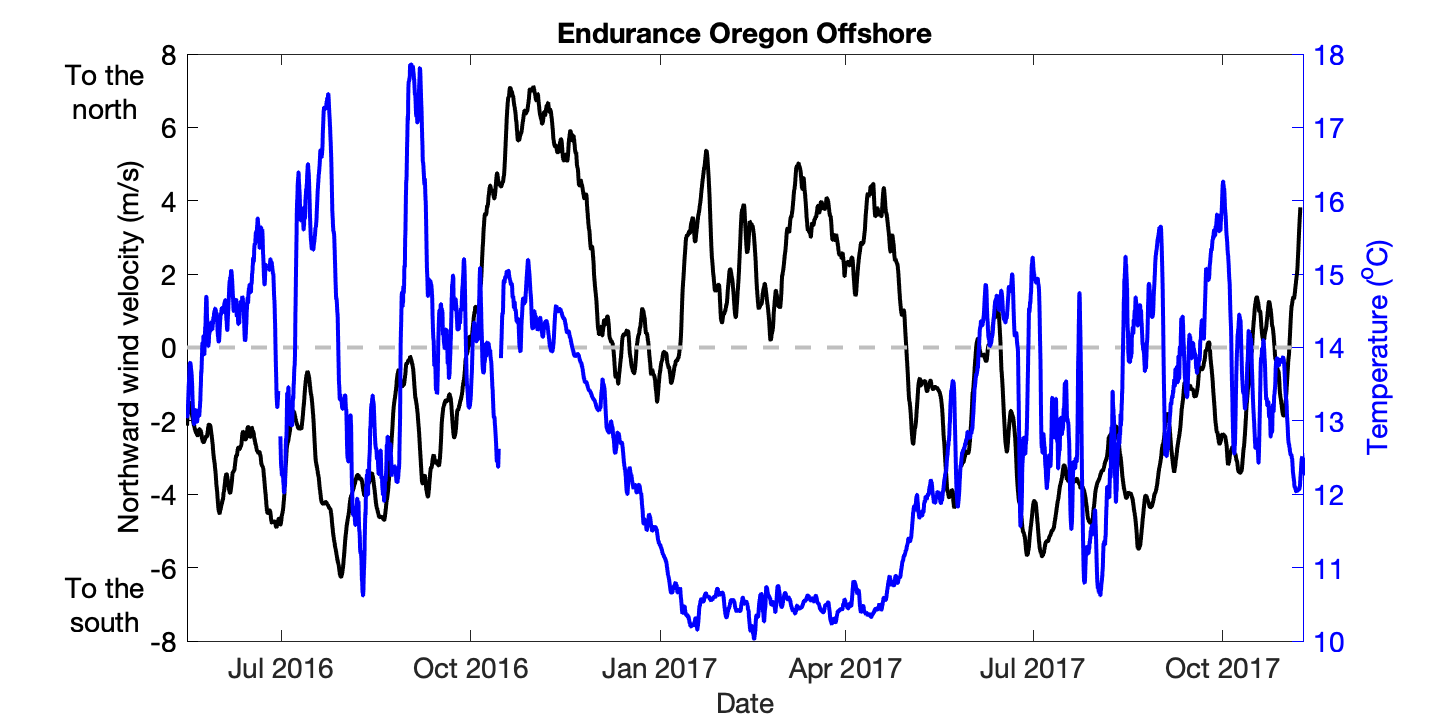
- Show this static time series figure (or this longer one) from the same time and place of the relationship between wind direction and water temperature. Discuss correlations between these variables and ask students to discuss with a partner what they think might be going on here. Lead a whole group discussion and ask guiding questions as needed to help them make the connection with coastal upwelling.
- Review coastal upwelling at this point to help students develop the understanding needed before the next step. (This video of Ekman transport generated upwelling may be useful)
Application
- Students use the widget to compare this temperate, coastal area to another one (that does not experience upwelling). A worksheet is provided to help students navigate through the data, make predictions, and explain their reasoning.
- Students are asked to predict seasonal changes in temperature off the coast of Massachusetts given the chlorophyll levels.
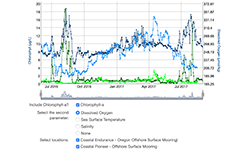
- Students can now see the full temperature time series and interactively toggle on and off the non-chl variables, toggle on and off the two locations, and zoom in and out of the data to explore it more.
- Revisit concepts focused on spring bloom initiation and termination in temperate environments.
- In the context of previous exercises, examine the relationship between sea surface temperature and primary production.
- Use this Earth Observatory Chlorophyll & Sea Surface Temperature animation to describe how upwelling influences regional primary productivity in other areas of the world.
- How do you expect other water characteristics (not only the dissolved oxygen and salinity already discussed, but also other water properties like pH, turbidity, and various nutrient levels) to change in conjunction with variations in sea surface temperature and chlorophyll concentrations?
- Ask what are the larger implications of water mixing, regional changes in primary production, and the resulting influence on food webs, fisheries, and migration patterns?
- How can changing levels of primary productivity influence food webs?
- How do these concepts relate to fisheries and other commercial and/or recreational industries?
Reflection
- Ask the students to consider how they learned, how much they learned, and how they applied their learning through one or more of the following:
- What new skills did you learn that helped you to explain the patterns you observed in the data?
- What concepts did you need to learn more about in order to make an explanation?
- What new connections between concepts did you make?
- In what ways did these connections help you to understand the concepts better?
- What was the most difficult part of this activity/unit/challenge for you? Why? What helped you to figure it out?
- Ask what specific impacts did/might these events have on them ( i.e. marine fisheries, recreational activities)? In what ways is this content meaningful and relevant to them and to you as the instructor?
- Have students write about what they learned. Then provide them with a copy of the enduring understandings and have them circle/underline/write about how that is similar and different from what they wrote. [Note: this is a good exercise for students to make sure they think about those ideas deeply and pull out the differences and similarities from how they are thinking about and understanding the concepts and how an expert thinks about the same ideas they've been wrestling with. They might only have gone as deep as looking at the patterns and correlations, rather than the bigger ideas described in the enduring understandings.]
Subject / Topics
Introduction to Oceanography
- Ocean currents: surface currents, upwelling/downwelling, Ekman transport
- Water chemistry: temperature, salinity, density, dissolved gases
- Primary production: what it is, regional and seasonal variability
- Marine fisheries
Grade Level
Undergraduate students in Introduction to Oceanography courses (for either marine science majors or non-science majors)
Data Scope
Our scope in exploring ways to use professionally-collected data in our teaching:
- Using professionally-collected data in teaching of concepts
- Visualizing data in a user-friendly and authentic way
- Enabling students to interactively engage with data in their learning to see the patterns as they are learning the why
Quantitative Skills
Most of the quantitative reasoning in this exercise revolves around reading and interpreting graphs.
- Water quality is determined by interpreting a time series of chlorophyll concentration. Students are asked to read the graph to determine axes, the date range, chlorophyll units, and minimum and maximum values.
- Students must examine multiple time series with the widget to deduce the relationship between chlorophyll and water temperature, salinity, and dissolved oxygen. They should see that there is a strong correlation between all three of these variables.
- They must also articulate temporal patterns in the data presented.
- Longshore wind direction is presented in a graph and students must make the connection between the direction on a graph and Ekman transport and associated upwelling and downwelling. [N-to-S winds cause upwelling while S-to-N winds cause downwelling.]
- Students compare and contrast U.S. west and east coast regions by making a prediction for east coast temperature using the relationship with chlorophyll that they generated for the west coast.
- Students compare and contrast U.S. west and east coast regions over time and in scale (magnitude) with respect to chlorophyll, water temperature, salinity, and dissolved oxygen.
Expansion ideas
- Use future data to examine nutrient concentration (phosphate and/or nitrate) and pH.
Science Explanation
TBD