Chlorophyll-a in Upwelling and Stratified Temperate Regions Application2
Your Objective
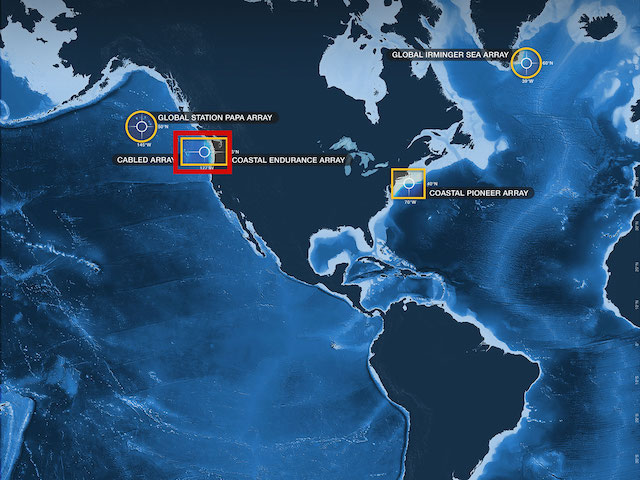
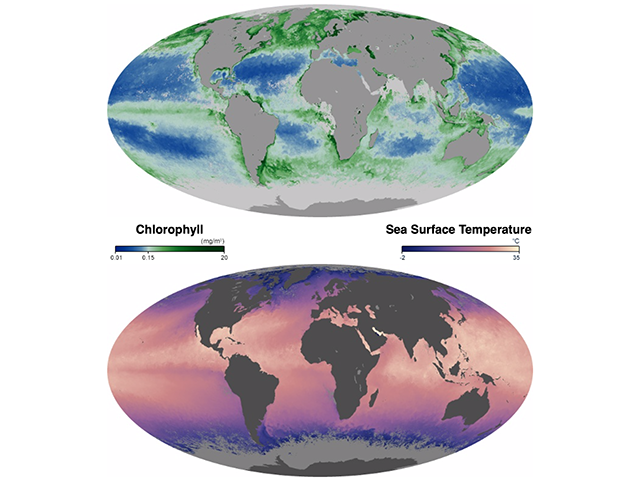
How does primary productivity, temperature, salinity and dissolved oxygen in the North Pacific Ocean Compare to the North Atlantic Ocean?
Compare patterns in chlorophyll-a concentration, salinity, and/or oxygen data between the Northern Pacific Ocean (Coastal Endurance Array) and the Northern Atlantic Ocean (Coastal Pioneer Array).
Make a prediction for temperature in the Northern Atlantic Ocean by drawing your own lines on the graph.
Select locations:
Take a look at the above charts. Then, use your mouse to draw your prediction for what the rest of the Pioneer Sea Surface Temperature dataset should look like for May-August 2017. After you have made your estimate, click the "Check Prediction" box.
Data Tips
Select the different locations to explore relationships and patterns in the data. Start by comparing each of the same variables at the two locations before looking at multiples. Zoom in and out of the data to look at different time scales across time to see if it changes the relationships or patterns you observe.
Questions for Thought
- How is temperature, salinity, and dissolved oxygen different during winter and spring?
- How should these water characteristics change when upwelling occurs?
- How does chlorophyll in the North Pacific compare to the North Atlantic in the summer and fall?
- How do the non-chlorophyll water characteristics in the North Pacific compare to the North Atlantic in the summer and fall?
- What are your predictions for temperature during this time period in the North Atlantic?
- What questions do you still have about what drives changes in chlorophyll (primary production) at the ocean surface over time?
- What do you predict the temperature timeseries should look like from May-August 2017, based on the data from 2016?
Background Information
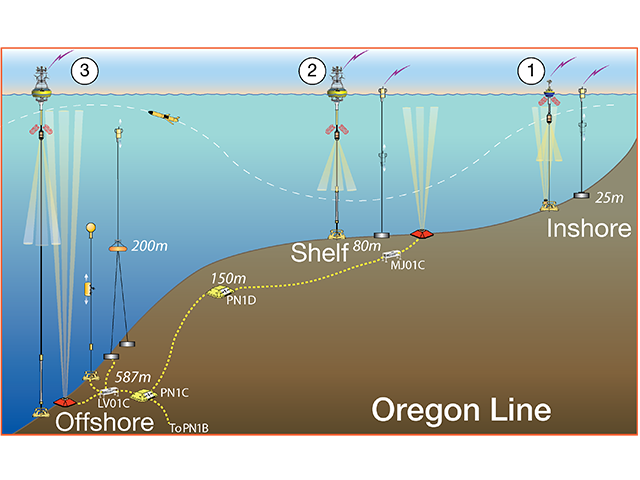
Click on the images below to learn more about where and how the dataset above was collected.

Dataset Information
The data for this activity was obtained from the following instruments:
- Coastal Endurance Oregon Offshore Surface Mooring
- Coastal Pioneer Offshore Surface Mooring
Recovered datasets were downloaded from the OOI data portal, and then daily mean averages were calculated and merged together into a single file for use in this activity.
See this Jupyter Notebook for details on how the data for this activity was processed.
Activity Citation: Baker, K., Condie, C., Ellis, R., Petrik, C., & Lichtenwalner, C. S. (2019). Chlorophyll-a in Upwelling and Stratified Temperate Regions. OOI Data Labs Collection.