Chlorophyll-a in Upwelling and Stratified Temperate Regions Exploration
Your Objective
What trends do you observe as primary productivity, temperature, salinity, and dissolved oxygen varies over time in the North Pacific Ocean?
Look for patterns in how the chlorophyll-a concentration, temperature, salinity, and/or oxygen data varies over time in the Northern Pacific Ocean (Coastal Endurance Array).
Include Chlorophyll-a?
Select a second parameter:
Data Tips
Select another variable (in addition to the green plotted Chlorophyll-a Concentration data) to explore the data in ways to investigate the different variables of primary production. Zoom in and out of the data to look at different time scales to investigate patterns across the year.
Questions for Thought
- How is temperature, salinity, and dissolved oxygen different during winter and spring?
- How should these water characteristics change when upwelling occurs?
- What is the data range and units for chlorophyll a on the y-axis?
- What changes or patterns did you observe at the surface in other variables (temperature, salinity, and dissolved oxygen) as chlorophyll changes over this time period off of Oregon?
- When (which months on the x-axis) did you see these changes or patterns taking place?
- What questions do you still have about what drives changes in chlorophyll (primary production) at the ocean surface over time?
Background Information
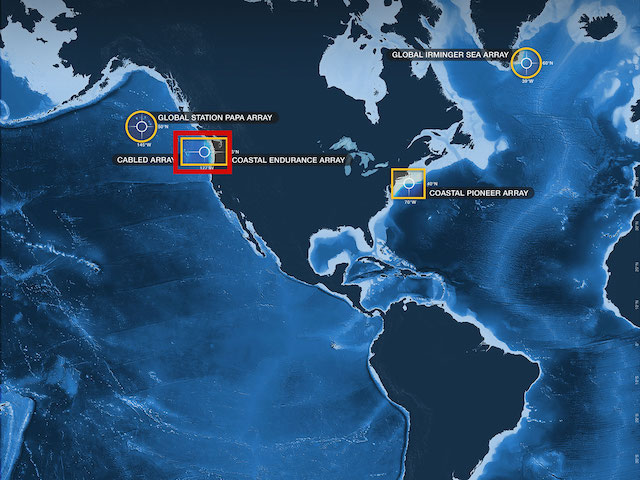
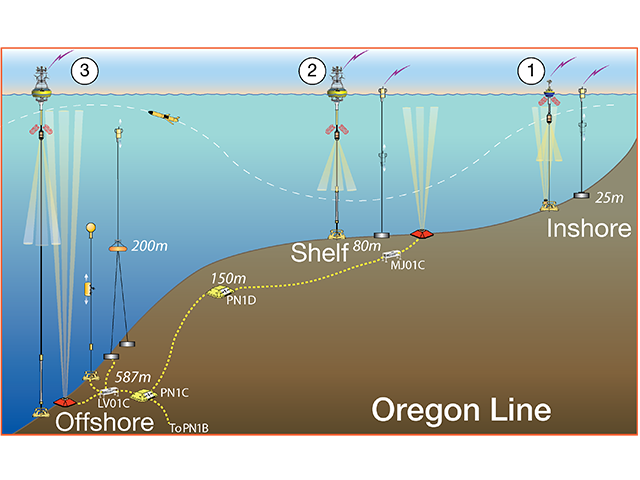
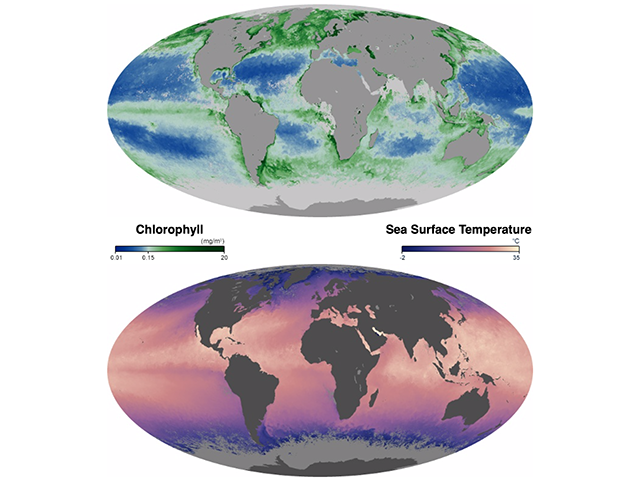
Click on the images below to learn more about where and how the dataset above was collected.
Dataset Information
The data for this activity was obtained from the following instruments:
- Coastal Endurance Oregon Offshore Surface Mooring
Recovered datasets were downloaded from the OOI data portal, and then daily mean averages were calculated and merged together into a single file for use in this activity.
See this Jupyter Notebook for details on how the data for this activity was processed.
Activity Citation: Baker, K., Condie, C., Ellis, R., Petrik, C., & Lichtenwalner, C. S. (2019). Chlorophyll-a in Upwelling and Stratified Temperate Regions. OOI Data Labs Collection.


