Plate Tectonics and the Seafloor - Instructor's Guide
Published February 13, 2020
Summary
This exercise introduces students to the connection between seafloor features and plate tectonic processes. It invites and encourages students to make their own observations, first by general identification of seafloor features, followed by application of plate tectonic principles to relate those features to the type of plate tectonic environment that generated them. Students will then use earthquake data to explore and interpret processes occurring within each tectonic environment. Lastly, students tie all of their observations together to propose a hypothesis about geologic and oceanographic hazards that may be present.
The lab exercise is set up in steps that progress from simpler concepts to more difficult ones. It is up to you how far to go with your students.
Enduring Understandings
The most important understanding that students are to gain from this exercise is that features, earthquakes, and hazard sources on the seafloor have a direct connection to the movement and interaction of Earth's tectonic plates.
Learning Goals and Assessments
After engaging with this Data Exploration a student will be able to:
- Apply their prior-learned background to a reality-based scenario using improved data skills.
- Interpret time-series and geographic earthquake data.
- Explain the relationship between seafloor features, earthquakes, and plate tectonics.
- Determine plate tectonic settings by connecting real-world relationships to background knowledge.
- Articulate some of the challenges that scientists face when data does not fit simple models.
- Identify a reasonable hypothesis for the potential natural hazards in the studied area.
Context for Use
This exercise can be used for both introductory and upper level oceanography (or geology) courses. As described above, it is set up as a series of steps in which students can progress as far as you want to guide them. However, it is presumed that students who use this exercise have, at a minimum, been introduced to the basic concepts of plate tectonics, including plate boundaries and interactions.
Teaching Notes
Learning Cycle Sequence
Check out the suggested sequence of activities for this Data Exploration.
For an overview of this activity and additional tips, you can also check out the webinar recording.
In addition to a basic understanding of plate tectonic theory, students should know the basic, physical layers of the earth and their characteristics (lithosphere, asthenosphere, mesosphere, outer core, inner core). It might also be helpful to familiarize students with the basic concept of earthquakes and their causes (see the Invitation section below). If you are going to have the students work through all of the steps or activities, then it would be helpful to the students to also know of the connection between earthquakes and tsunamis, and to be familiar with the concept of a natural hazard. They should also know what it means to form a hypothesis.
To help students understand the connections between the seafloor, natural hazards, and plate tectonic processes as presented in this exercise...
Invitation: (all of these activities are optional, but you might have your students do one or more of the following)
- Using Google Earth, show the students the area around Japan, including the Japanese Trench, and then remind the students of the events related to the 2011 Tohoku Earthquake and Tsunami. If not already seen, show the students footage of the tsunami (recommended video).
- Explain to the students that this exercise will introduce to them the type of information that can help them to determine if a similar event has the potential to occur at other locations.
- Ask the students what they would need to know in order to determine if a similar hazard exists at another location. Have them write down these ideas. (ANSWER: Three very important things are: volcanoes, earthquakes, and a trench — be aware that the Pacific Northwest has the volcanoes and earthquakes, but not the trench due to the fact that the Juan de Fuca Plate is subducting at a very shallow angle. It is important to help the students to recognize subduction without the obvious presence of a trench — see below).
- Prior to the start of the exercise, ask students to briefly discuss with a partner, or in a small group, what they know about plate tectonics. After giving them a short time do this, lead a whole group review of the three basic types of plate boundaries (convergent, divergent, and transform) and the typical features associated with each type of boundary.
- Show students a global map of plate boundaries and have them discuss with a partner, or in a small group, what they think are the impacts that plate movement and interactions can have on human populations and the natural environment. Lead a whole group discussion afterwards, of their ideas and add information and clarification as needed.
- After showing the following video to the students, you might do the following:
- Underwater Earthquake Video (if that page doesn't work, here is a YouTube version). This is a video of the impacts of an earthquake underwater. The video was taken by Jan Paul Rodriguez in the Mabini (Batangas Province), Philippines in early April 2017. The magnitude of the earthquake was 5.7.
- Ask the students to describe their observations. What might have caused the motion of disturbance of the water? (Answer: an earthquake)
- What might have caused the earthquake? (Answer: movement along a fault and breaking of rock).
- Ask them to discuss the impacts the motion of the seafloor might have on the shape of the seafloor, marine organisms, and/or coastal areas. What predictions can you make about the impacts from an even larger earthquake?
- You can introduce the relationship between plate movement and earthquake formation by demonstrating the breaking of a wooden pencil (the hexagonal kind, not the round kind). As you slowly bend the pencil, talk about how energy is built up within the pencil (and lithosphere) as force is applied. Have the students listen quietly as you slowly bend the pencil. There should be some small cracking sounds before the pencil completely breaks. Ask the students what they think is happening to cause the sounds (correct answer: bonds breaking within the pencil). Finally, bend the pencil enough to break it completely. Explain to the students this break is a "pencil quake" and that earthquakes occur in the same way, as plate tectonic forces store energy in the earth's lithosphere until the rocks break, causing an earthquake. This exercise can be done at any time during the exercise - wherever you think it would be most appropriate.
Exploration:
- Have students access the exploration exercises either as individuals or in groups of 2 to 3. Give them time to work through each exploration exercise, one at a time. You can choose to work through them all, or just the ones you choose.
- Give the students opportunity to work without promptings or suggestions. Allow them to just explore a bit on their own. After this time, or if it is apparent that students are becoming confused or frustrated, pause the exercise and open the class up for questions.
- At the end of each exercise, once the students have had a chance to explore it and formulate answers to the questions, bring the class back together and ask them questions about what they discovered or learned. In addition to reviewing the questions that are part of the exercise, you can ask other questions such as:
- What features of the seafloor are most recognizable?
- Are there any recognizable shapes of patterns related to the seafloor features?
- What patterns do you see in the location of earthquakes? What about patterns over time? Be ready to share the evidence that supports your observations.
- Which type of earthquake data (location or time series) is the easiest to interpret? Explain why you think that.
- Have the students describe any patterns that they might see.
Concept Invention:
- Help students to understand the connection between seafloor features and plate tectonics. Have them discuss their ideas with partners or in small groups before leading a whole group discussion of their ideas using questions like the following:
- Are there any apparent relationships between seafloor features and plate tectonics? How might they be connected? What evidence or concepts lead you to this idea?
- What evidences exist for plate tectonic processes occurring in this area?
- What patterns do you see in the earthquake locations and depths? How might this information help you to understand what plate tectonic processes are occurring?
- Lead students in a whole group discussion of their observations after the data activity, calling on students to provide the evidence that led them to their conclusion about the connections. Ask others to add to their explanation or offer alternative evidence or conclusions.
- Ask the students to identify the locations of convergent, divergent, and transform boundaries. What features or earthquake data confirm their interpretation?
- Discuss with the students why the earthquakes located around the mid-ocean ridge and transform zones are shallow, while those that run parallel to the coast of North America are generally deep.
- After, or as part of the discussion, show students a cross-section of a subduction zone. Ask the students to discuss with partners or in small groups if the concept of subduction makes sense. Does it fit the earthquake data? Why or why not? You can encourage them to share their ideas with the class and add information or clarification, as needed.
- Ask them to discuss with ideas with their partners or in small groups. What questions still remain? What more information do we need to be more sure of our conclusions? Have them write these down.
Application:
- Compare the area of this exercise with other areas of the world using Google Earth. Ask the students if they know of or have experienced earthquakes for a given location. What was the experience like? Where was it? How was the area similar to the one in the data exploration? This is also a good opportunity to refer back to the Tohuku Earthquake and Tsunami if you used that invitation exercise.
- Have students discuss the following:
- What is the potential for such an event occurring in the area that they have explored? What plate tectonic similarities exist between Japan and the Pacific Northwest? What does the earthquake data indicate about the build up of tectonic energy (refer back to the breaking pencil demonstration)?
- Ask students to discuss whether residents in the Pacific Northwest should be worried. What additional data might be helpful to clarify the potential threat (data such as occurrence interval (link 1 and link 2) vs the length of the record from the USGS and OOI)? Why does it matter?
Reflection:
- Have the students reflect and think about what they have learned. Ask questions like:
- Do you think any differently now about the relationship between features on the seafloor and plate tectonics? How about between earthquakes and seafloor features? How do earthquakes, plate tectonics, and seafloor features relate?
- Why do we care about collecting the type of data used in this exercise?
- What are the limits to what the data does or doesn't tell us? What additional data would be useful to have?
- Ask the students to consider how the knowledge that they have gained in this exercise applies to them. In what ways?
- What specific skills did they gain or find useful in the exercise? How else might those skills be applied in their lives?
- Was there anything that they found new or surprising?
- What was difficult or challenging about this exercise? What additional information would have made things clearer or more understandable?
Subject / Topics
- Earthquake(s): epicenter(s), energy build-up and release
- Seafloor features: seamounts, mid-ocean ridge, transform zone, deep sea trench
- Plate Tectonics: plate boundaries, plate movement, subduction
- Natural hazards: earthquakes, tsunamis
These exercises should be used to give students their own "hands-on" experience in understanding plate tectonic processes — applying what they have learned previously. It requires them to apply map-reading, data interpretation, and synthesis skills. The terms and topics listed above should mean something more to the students by the time that they finish this exercise.
Grade Level
These exercises are for use in undergraduate Introduction to Oceanography courses, for both marine science majors, as well as non-science majors. They could also be used for advanced high school students, such as those in AP science courses. Students who do these exercises are expected to have already been introduced to basic plate tectonic concepts.
Data Scope
The data in these exercises consist mostly of seismic, geographic, and time-series data. Students are given the opportunity to:
- Use professionally-collected data.
- Visualize and interpret oceanographic and geographic relationships.
- Interact with data in a user-friendly way.
Quantitative Skills
The quantitative skills in these exercises are related to the interpretation of a time-series plot and map reading.
- Seafloor features are featured on a digital, physiographic map. Students are asked to identify these bathymetric features, including their locations and relationships. Students will need to understand map orientation and approximate scale. They will also need to recognize how elevation represented on the map.
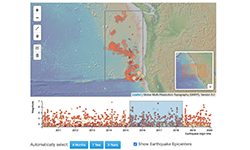
- Epicenters are presented geographically in both location (in 3-dimensional space) and scale. Students will need to recognize that the diameter of the epicenter symbol represents magnitude scale and that the color represents depth within the earth.
- Epicenters are also plotted as a time-series graph. Students will be need to recognize that the y-axis represents magnitude and that the x-axis represents time. Color, again, represents depth.
- Students should be able to make connections between location, depth, and magnitude.
Expansion ideas
For more advanced students, an emphasis on earthquake patterning in time vs space is recommended. Discussions could revolve around:
- Having the students calculate earthquake recurrence intervals for various ranges of earthquakes.
- Focusing on larger clusters of earthquakes and the features that they may be associated with.
- Why does the subduction of the plate beneath Japan form a much deeper trench than the subduction beneath the Pacific Northwest? Students can calculate distance (and age) between the subduction zones and the mid-ocean ridge.
Additional resources for instructors
- An article about the underwater earthquake video
- A National Geographic Society introduction to the 2011 Tohoku, Japan earthquake
- USGS resources related to the 2011 Tohoku, Japan earthquake
- The State of Washington's Department of Natural Resources page on tsunami hazards
- The IRIS Earthquake Browser (an interactive, earthquake map of the world)
Science Explanation
The Theory of Plate Tectonics is the grand, unifying theory of earth science. The basic idea is that the outermost, physical layer of the earth, the lithosphere, is brittle and thus broken into sections called tectonic plates, much like the thin shell of an egg is brittle and can be broken (see figure).
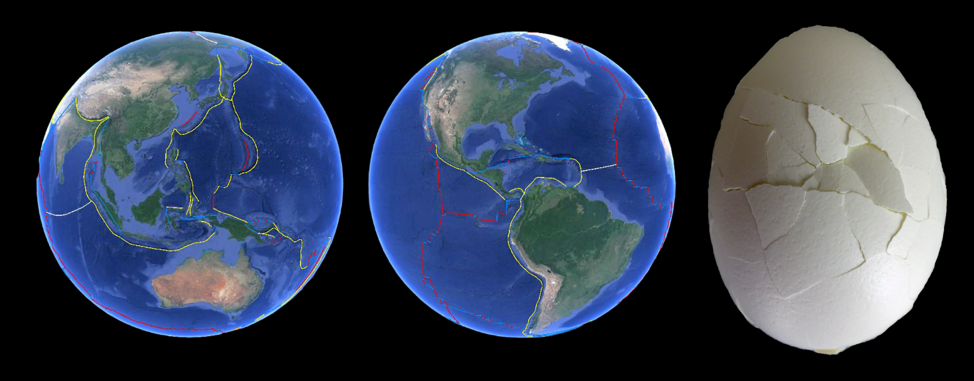
Much like the shell of the egg in this image, the outer layer of the earth, or lithosphere, is a brittle layer that is broken is sections. These sections are called tectonic plates (image copyright: Benjamin R. Jordan, used with permission; Earth images after Google Earth).
These plates float on top of a more fluid, but still solid, layer called the asthenosphere. The plates of the lithosphere ride on top of the asthenosphere and move due to convection within the earth (see figure).

The lithosphere is the outermost layer of the earth. It sits on another, softer (but still solid) layer, called the asthenosphere. Although solid, the rocks within the earth still move in slow convection cycles. This movement is directly connected to the movement of the lithosphere's tectonic plates (image copyright: Benjamin R. Jordan, used with permission).
These plates move relative to each other, sometimes colliding (forming mountains and explosive volcanoes), sometimes pulling apart (forming rift valleys and mid-ocean ridges), and sometimes sliding past each other (forming strike/slip faults and transform zones between mid-ocean ridge segments) (see figure).
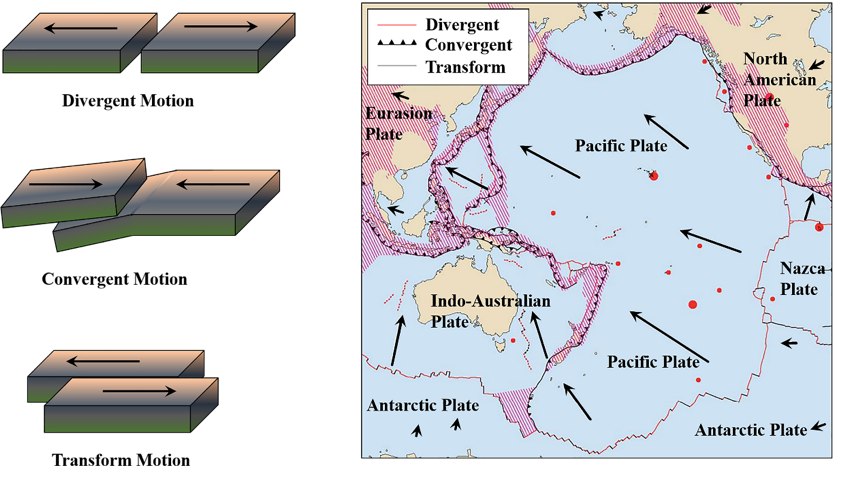
Tectonic plates interact in three main ways: divergence, convergence, and transform motion (image copyright: Benjamin R. Jordan, used with permission; right image after USGS).
These interactions are directly related to many of the features that we find on the seafloor, such as volcanic seamounts, mid-ocean ridges, transform and fracture zones, and deep sea trenches (see figure).
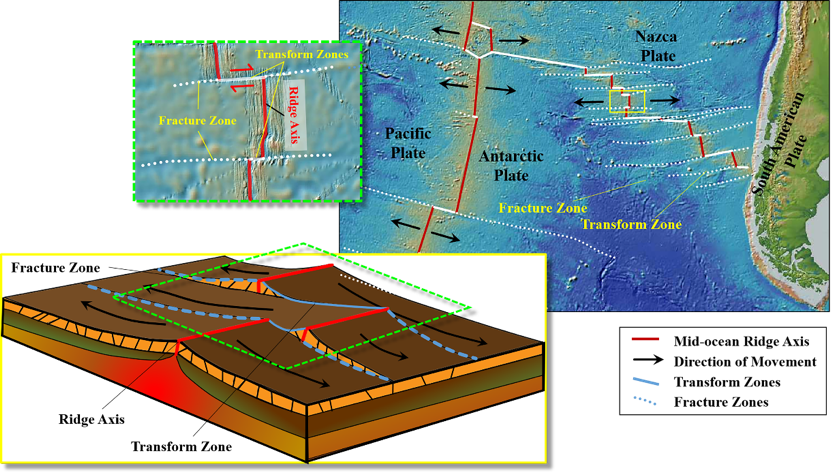
The most obvious example of a boundary between plates occur at mid-ocean ridges, where plates move apart from each other (image copyright: Benjamin R. Jordan, used with permission; upper images after map imagery from the Global Multi-Resolution Topography (GMRT) Synthesis, funded by the National Science Foundation (NSF).
These interactions between tectonic plates lead to earthquakes as tremendous amounts of energy are built-up and then released, much like energy is built up within a pencil as it is bent. Eventually the strength of the wood will be overcome by the energy and the pencil will break (see figure).
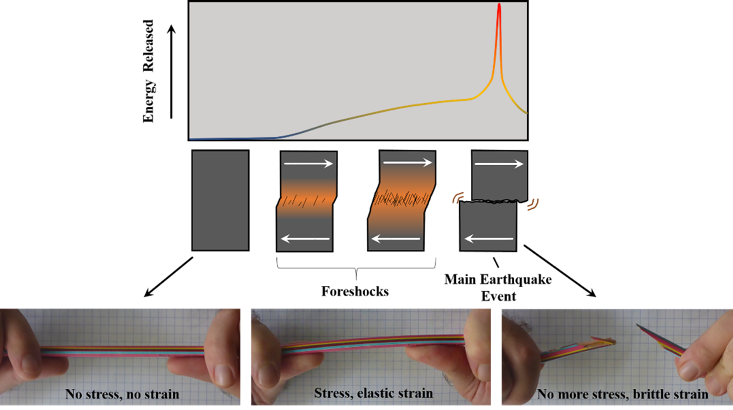
Much like bending a pencil will eventually lead to it breaking, Tectonic forces within the lithosphere will lead to the breaking of rock, forming an earthquake (image copyright: Benjamin R. Jordan, used with permission).
By examining the size and location earthquakes, we learn something about the behavior of tectonic plates. For example, the deepest earthquakes occur in convergent settings, where one plate subducts beneath another (see figure).
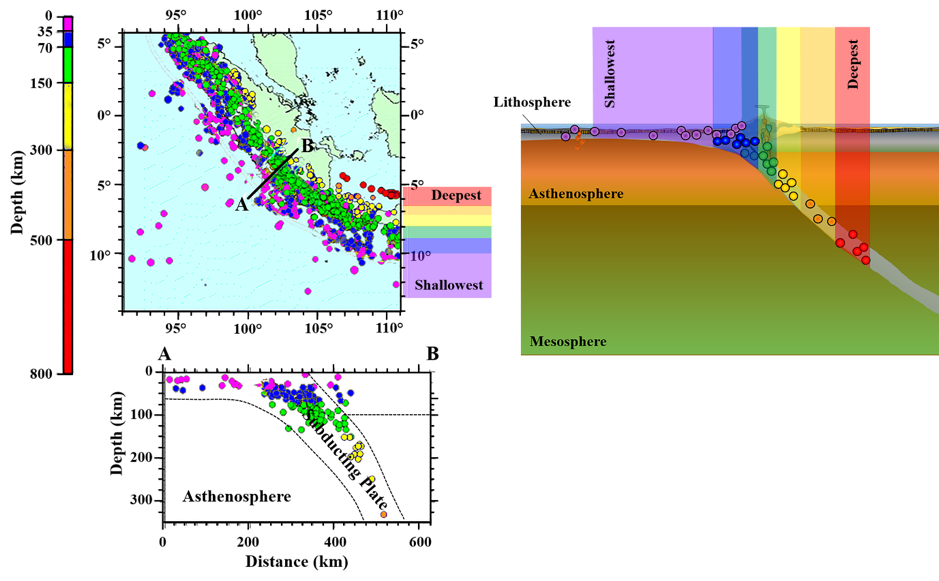
Because earthquakes occur within the brittle lithosphere, the depth and location of an earthquake tells us something about the geometry of a subduction zone (image copyright: Benjamin R. Jordan, used with permission; left figures after USGS).
If, as part of the earthquake, the seafloor is disturbed, either by direction movement of the seafloor, or by the generation of a underwater landslide, the energy from this disturbance can be transferred to ocean itself, forming a tsunami (see figures). Thus, areas of active plate tectonic interactions within the ocean present a significant natural disaster hazard.
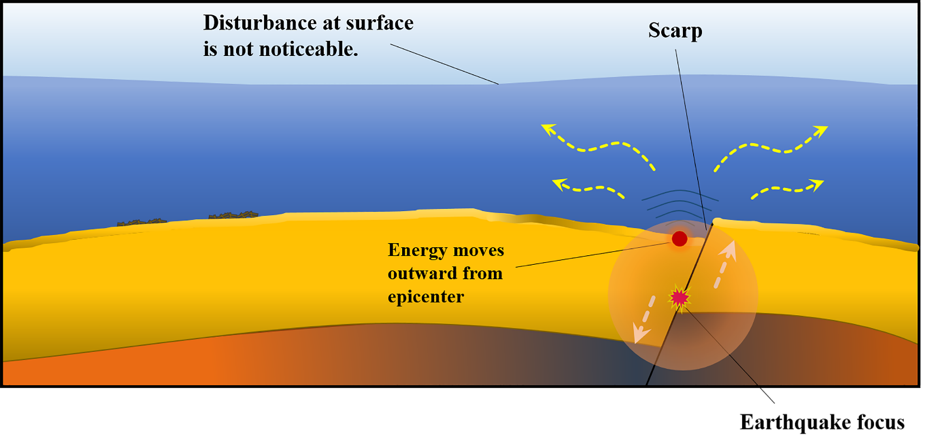
If the surface of the seafloor is displaced, its motion will transfer energy into the overlying water, forming a tsunami wave (image copyright: Benjamin R. Jordan, used with permission).
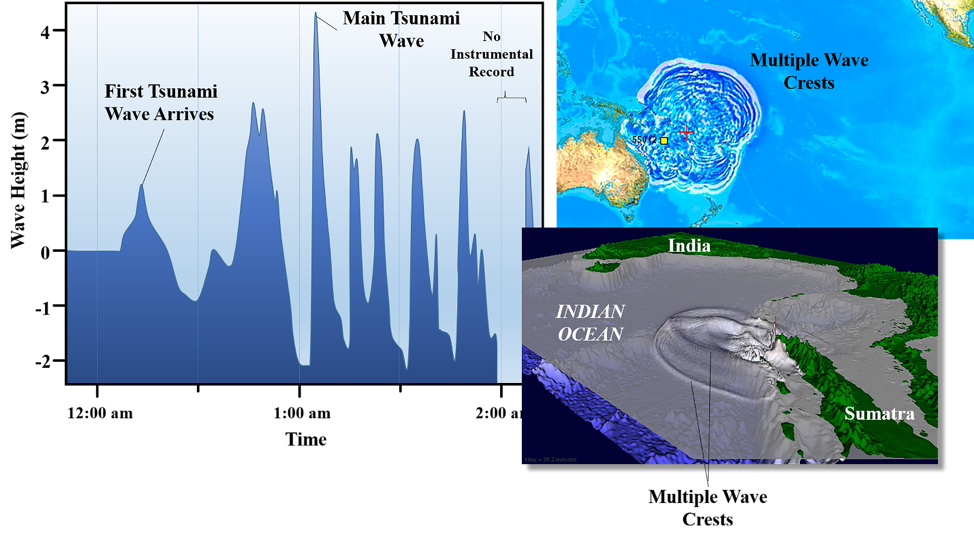
A tsunami wave moves radially out from its source, much like the ripples from a rock tossed into a pond. A tsunami usually consists of multiple waves, not just one. In fact, the largest wave of a tsunami is often NOT the first one that reaches land (image copyright: Benjamin R. Jordan, used with permission; bottom right image after USGS; upper right image after NOAA/PMEL/Center for Tsunami Research).

Once a tsunami wave reaches shore, it can arrive as a massive surge of water, several meters high. The bottom, center image denotes the height of the tsunami wave that is shown in the other two images. This wave hit Hilo, Hawaii in 1946 (image copyright: Benjamin R. Jordan, used with permission; top left image courtesy of NOAA; top right image courtesy of USGS).