Plate Tectonics and the Seafloor Exploration
Your Objective
Use earthquake and bathymetry data to make observations about seafloor features and potential tsunami hazards.
- Explore the data to see what observations you can make.
- Describe the possible relationship between the earthquakes and tectonic boundaries.
- Make predictions of locations for potential tsunami generation.
Automatically select:
Note, colors represent earthquake depths: reds are shallow (0km), yellows are mid-range (25km) and blues are deep (50km). Most dots are in the orangish range, approximately 10km below the seafloor. Circles in the map are sized by earthquake magnitude, from 2.5-6.8.
Data Tips
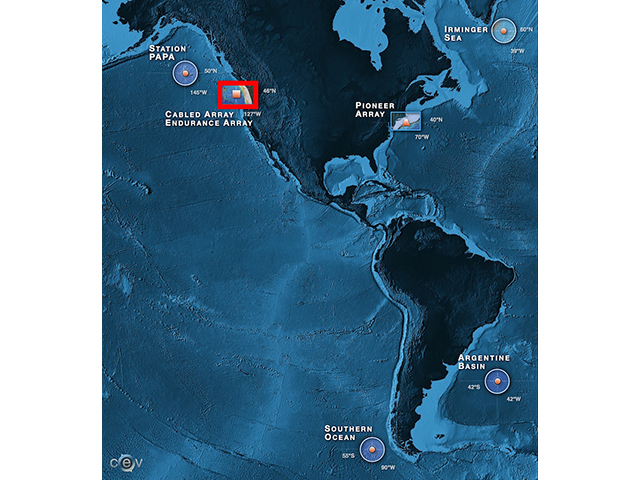
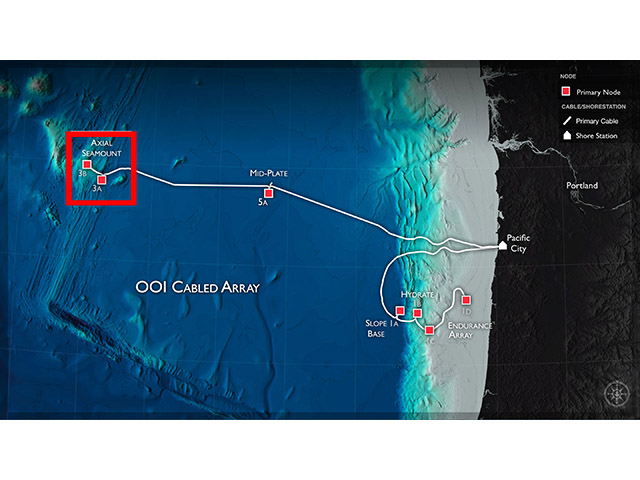
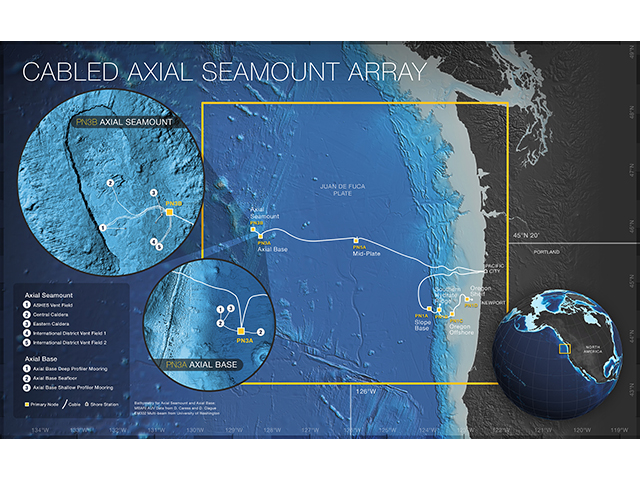
When the site loads, you are able to see the bathymetry of an area in the northeastern region of the Pacific Ocean. You also have the option to turn on a layer indicating earthquake locations for 2010 to 2017. The data was collected using the Cabled Axial Seamount and Cabled Coastal Arrays. You can interact with the data by:
- Zooming in and out of the map and by clicking and dragging it.
- Toggling between the bathymetry map and earthquake locations.
- Adjusting the slider to view earthquakes over a specific time period.
Questions for Thought
- Where is the land and where is the ocean?
- Across what time periods are you able to observe oceanic or geologic variables in the plot?
- What is the first month and year there are data?
- What is the last month and year there are data?
- What is the range of earthquake magnitude?
- What oceanic or geologic features can you see?
- What type of tectonic plate boundaries are present in this area?
- Are their patterns associated with the earthquakes relative to size and location? Do these make sense?
- What type of plate boundary apparently has the smallest magnitude earthquakes? Does this make sense? Why or why not?
- What might be indicated by the number and size of earthquakes both presently and the future?
- If a large earthquake were to occur near the continental slope, how might it affect the slope? What other hazards might be associated with such an earthquake?
Background Information
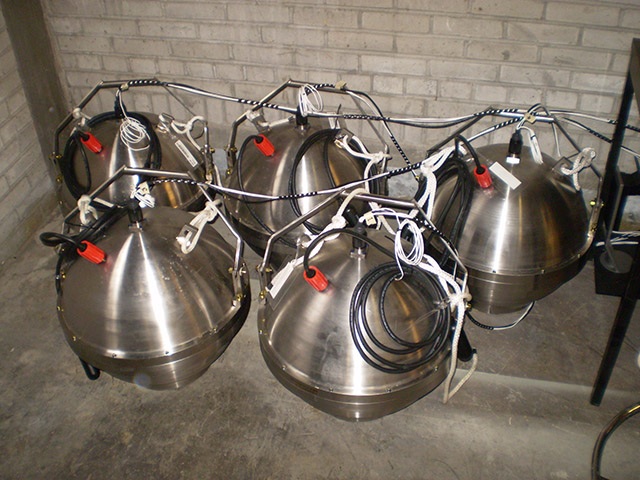
Click on the images below to learn more about where and how the dataset above was collected.
Dataset Information
The earthquake dataset for this activity was downloaded from the USGS Earthquake Catalog.
Activity Citation: Jordan, B. & Lichtenwalner, C. S. (2020). Plate Tectonics and the Seafloor . OOI Data Labs Collection.


