Changes in Salinity - Instructor's Guide
Published June 24, 2019
Summary
This collection consists of 3 sets of activities. Part One is focused on data exploration activities, to be used during the Exploration phase of the Learning Cycle. Part Two is focused on the Concept Invention phase of the Learning Cycle. Part Three is focused on the Application phase of the Learning Cycle.
These activities were developed to assist with students' understanding of various concepts of sea surface salinity and variables that affect salinity. Ideas are provided to assist students with visualizing data collection stations, reading graphs of salinity and other parameters, and relating salinity to other parameters between locations. The Exploration phase introduces students to time-series data and allows for the interpretation of data trends, focusing on sea surface salinity at a single station in the North Pacific Ocean. The Concept Invention phase introduces atmospheric and oceanic processes as additional data points. The inclusion of these data prompt the student to find patterns and make connections between the various parameters. The Application phase is similar to the Concept Invention phase in that it examines changes in sea surface salinity and oceanic/atmospheric parameters over time, yet this exploration also includes data from other OOI arrays allowing students to view changes over both temporal and spatial scales. This set of data explorations takes students from a very basic introduction to data, data visualizations, and data interpretation, through more complex examinations of ocean/atmospheric connections, and eventually comparisons of these parameters and trends at large-scale spatial levels.
Learning Goals
After engaging with this Data Exploration a student will be able to:
- Interpret basic time-series data visualizations and identify changes and patterns.
- Compare time-series air temperature, salinity, precipitation, and sea surface temperature data at a coastal site over time to explore the data for changes and patterns.
- Compare time-series air temperature, salinity, precipitation, and sea surface temperature data at a Pacific Ocean coastal site, Atlantic Ocean coastal site, and Atlantic Ocean offshore site over time to explore the data for changes and patterns both temporally and spatially.
Context for Use
These data explorations were designed for implementation in an introductory oceanography course (majors and/or non-majors). These activities would be appropriate for use in learning how to read graphs and interpret the data within graphs, as well as examining the concepts of seawater properties and the processes that affect those properties.
Teaching Notes
The Data Exploration activities require access to an internet-ready computer or tablet. Ideally each student or pairs of students would have a computer or tablet to use to engage with the activity.
Alternatively, if no internet access is available for each student or pairs of students, graphs of the specific time periods of interest and variables could be printed onto plastic overlays for each student or group of students.
Note, the Data Explorations use authentic raw data. Many of the datasets have been downsampled for simplicity and to ensure that the interactives load quickly in your browser. However, this means that many of the datasets retain their natural variability and some sampling side-effects. The goal of these activities is for students to analyze authentic data, not smooth averages. Effort has been taken to maintain as much of the data and to keep the variation of the data as true as possible, but make the activity user-friendly and browser-friendly. The display and comparison exercises also illustrate the importance of collecting and analyzing data from an extended time series. A few months of data would not be adequate for showing relationships and variability.
To help students understand changes in salinity...
Invitation: As an introductory activity, you can:
- Provide a visual aid of salinity by weighing out a certain mass of salt for a given volume of water in a bottle or beaker, and/or compare it to another greater (or lesser) mass, as representatives of typical ocean salinities, or
- Show videos that illustrate the idea of salinity (i.e., person floating in Dead Sea), or
- Engage the students in a nested data set project. This project can be used as an introductory activity (before the lesson) or extension activity (after the lesson) as a means of getting students engaged while developing a personal connection to the data. Students will collect their own daily salinity data (if geographic location allows) over a period of time (weeks, months, semester), plot their data, examine trends, and attempt to correlate local atmospheric conditions to local salinity trends and/or to trends in other locations, or
- As an introduction to graphs/data visualization, present idealized unlabelled graphs showing salinity over time, etc. and have students label them, or
- Whatever you currently are using
Exploration: To help students recognize that salinity changes over time you can:
- Use the data to identify any patterns in salinity over time (months, seasons) from 2015 to 2018 as a guided activity, or
- Use the data to complement something else that you are already doing.
Concept Invention: To help students understand the processes that affect salinity you could:
- Engage in a discussion about the factors that control salinity.
- Direct the students or groups to predict how each of the non-salinity variables might affect the salinity; then test their hypothesis by toggling the non-salinity variable buttons, and then follow up with a discussion about their results.
- Discuss the different possible causes for a correlated relationship. (chance, causation, causation by a different factor)
- Something else that you are doing already
Application: To help students link their observations of salinity changes in one location to global changes, you could:

- Compare and contrast the trends or patterns identified in the exploration and concept areas to other locations and discuss any similarities or differences observed, or
- Jigsaw activity where students or groups are assigned one other location to compare to the Oregon location and discuss their findings (pooling data to see the big picture).
- Jigsaw activity where students or groups are each assigned a graph of one variable in a single location to interpret and explain to other groups (Pooling data to see the big picture)
- Explore other areas you are already using and extend to the global ocean, or
- Engage in an extension discussion on the impact that changes in salinity have on global circulation and/or life in the oceans (charismatic megafauna).
- Demonstrate that waters with different salinities have different densities to establish the idea that higher density water sinks, and tie that into global circulation.
- Develop guided questions for culmination activity
- Do something else that you are doing already
Reflection: You could...
- Revisit the concept map you created at the beginning of the exercise and make changes to reflect what you have learned in this activity.
- Some of these questions: What new skills did you learn that helped you to figure out what was happening? What concepts did you need to learn more about in order to figure out the mystery? What new connections between concepts did you make? In what ways did these connections help you to understand the concepts better? What was the most difficult part of this activity/unit/challenge for you? Why? What helped you to figure it out?
- Something else that you are doing already
Subject / Topics
Introduction to Oceanography
- This exercise could have students revisit learned concepts, such as wind direction, Ekman transport and upwelling, and ask students to apply them to explaining a very real situation. If these topics have not yet been covered, this example can provide the impetus to learn about them. It requires taking information in one form, mostly graphs, and using it to answer questions and conceptualize what it means about the different locations examined. It also requires students to consider what additional data they might like to have in order to develop a more complete understanding of the processes involved.
- In introductory classes instructors may want to have students grapple with one or a couple of the concepts and the instructor can provide the details for other concepts.
- In more advanced classes students should be challenged to recall previously learned information and apply it to this problem. Instructors should be ready to jog the student's memories about the previously learned information.
Grade Level (2 options)
- Undergraduate course for majors and non-majors
- This exercise can be a case study in an upper-level Physical Oceanography and Chemical Oceanography course, where students access additional data (such as dissolved gases, wind speed and direction, etc.) and consider the effects of processes such as Ekman transport and upwelling and downwelling.
Data Scope
Our scope in exploring ways to use professionally-collected data in our teaching:
- Using professionally-collected data in teaching of concepts
- Visualizing data in a user-friendly and authentic way
- Enabling students to interactively engage with data in their learning to see the patterns as they are learning the why
Quantitative Skills
Most of the quantitative reasoning in this exercise revolves around reading and interpreting graphs.
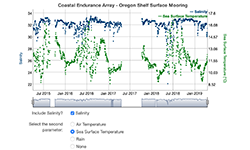
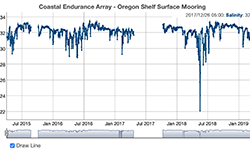
- Salinity changes are observed by interpreting a graph of salinity measurements taken over the span of several years. Students are asked to read the graph to determine if there is a pattern.
- With the help of the widget students will examine time series of air temperature, sea surface temperature, and precipitation. They should determine whether or not there is a correlation between any of these variables and salinity.
- With the help of the widget students will examine time series of air temperature, sea surface temperature, and precipitation from three different location. They should determine similarities and differences between the locations.
Science Explanation
TBD