Changes in Salinity Invention
Your Objective
Use water and atmospheric conditions data at and above the ocean surface from the North Pacific Ocean to identify patterns in sea surface salinity.
- Make predictions and formulate hypotheses about surface salinity changes and the drivers of these changes in one location.
- Use atmospheric and sea surface data to test predictions about sea surface salinity changes in this location.
Include Salinity?
Select the second parameter:
Data Tips
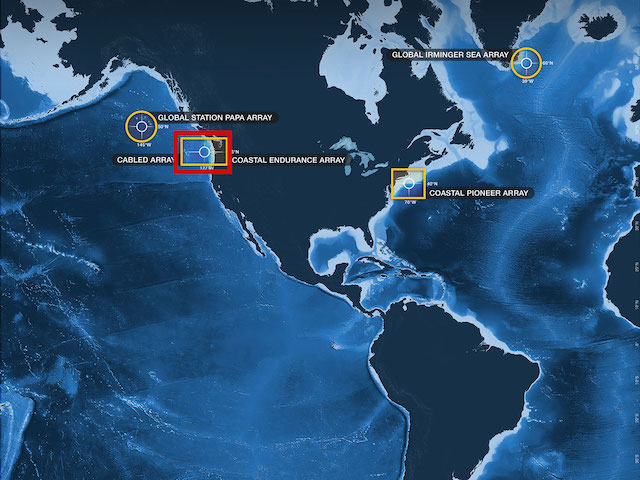
When the site loads, you are able to see the full salinity dataset from the Oregon Shelf Surface Buoy in the Coastal Endurance Array. You can interact with the data by:
- Turning on and off different oceanic or atmospheric variables to compare their data to the salinity data.
- Zooming in and out of the data to look at different time scales that interest you by changing the width of the highlighted section of the bottom graph (it loads with all of the data highlighted).
Questions for Thought
- What oceanic or atmospheric variables can you look at in these graphs?
- Across what time periods are you able to observe oceanic or atmospheric variables in these graphs?
- What is the first month and year there are data?
- What is the last month and year there are data?
- What changes or patterns did you observe at the surface in other variables as salinity changes over this time period off of Oregon?
- When did you see these changes or patterns?
- Describe how the different oceanic and atmospheric variables affect salinity levels at this location, i.e., identify any correlations/relationships between variables?
- Explain the reasons behind the relationships between the variables, if any.
- What questions do you still have about what drives changes in salinity at the ocean surface over time?
Background Information
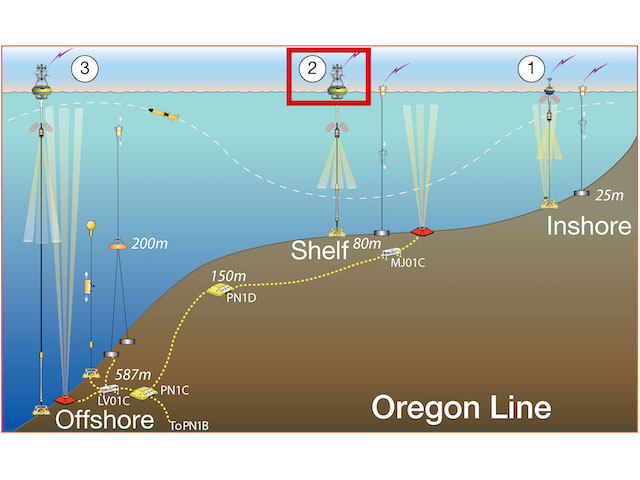
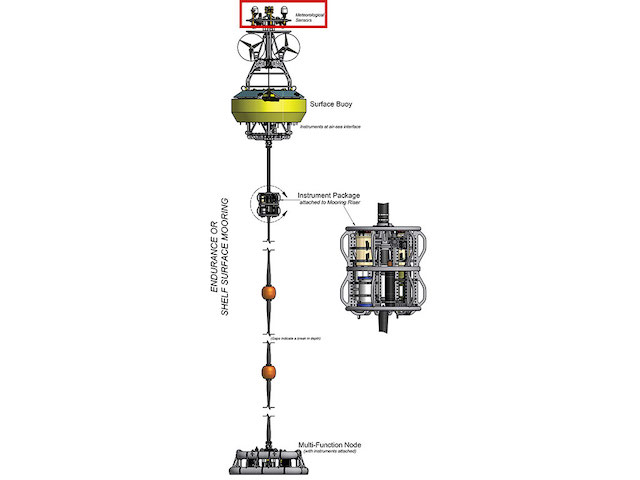
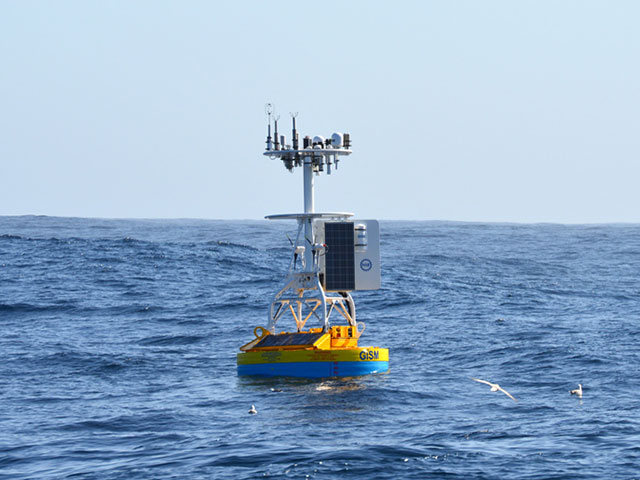
Click on the images below to learn more about where and how the dataset above was collected.
Dataset Information
The data for this activity was obtained from the following Bulk Meteorological instruments:
- Coastal Endurance, Oregon Shelf Surface Mooring (CE02SHSM-SBD11-06-METBKA000)
The above datasets were downloaded from the OOI data portal. Both telemetered and recovered datasets were used from each instrument to stitch together the best available dataset. Daily averages (means) of the temperature and salinity were calculated and the various datasets merged together into a single file. Daily precipitation was calculated by summing the calculated 15-minute rainfall measurements.
See this Jupyter Notebook for details on how the data for this activity was processed.
Activity Citation: Phillips, M., Helgers, K., Olney, J., Semcheski., M, & Lichtenwalner, C. S. (2019). Changes in Salinity. OOI Data Labs Collection.