Changes in Salinity Exploration
Your Objective
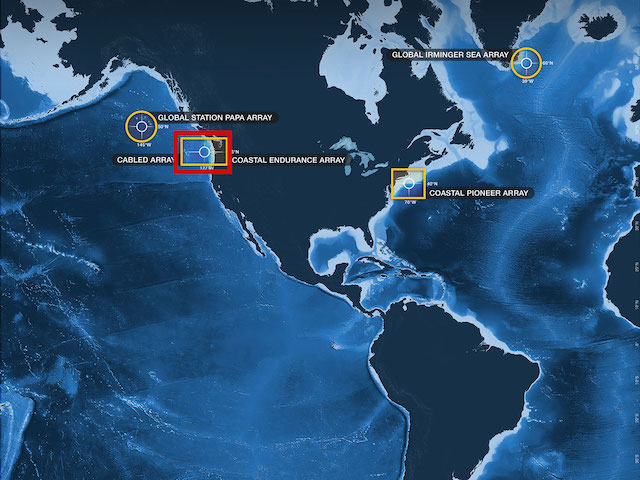
Use sea surface salinity data from the North Pacific Ocean to identify patterns over time. Explore salinity data at one location over time.
Data Tips
When the site loads, you are able to see the full salinity dataset from the Oregon Shelf Surface Buoy in the Coastal Endurance Array. You can interact with the data by:
- Zooming in and out of the data to look at different time scales that interest you by changing the width of the highlighted section of the bottom graph (it loads with all of the data highlighted).
Questions for Thought
- What variable are you looking at in this graph?
- In what location was these data collected?
- Across what time periods are you able to observe this variable?
- What is the first month and year there are data?
- What is the last month and year there are data?
- What changes or patterns in salinity did you observe at this location over time?
- When did you see these changes or patterns?
- What do you think might be driving these changes?
- What questions do you still have about changes in salinity at the ocean surface over time?
Background Information
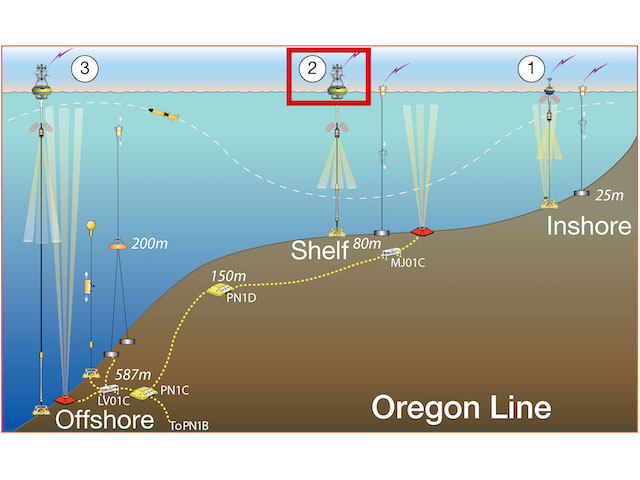
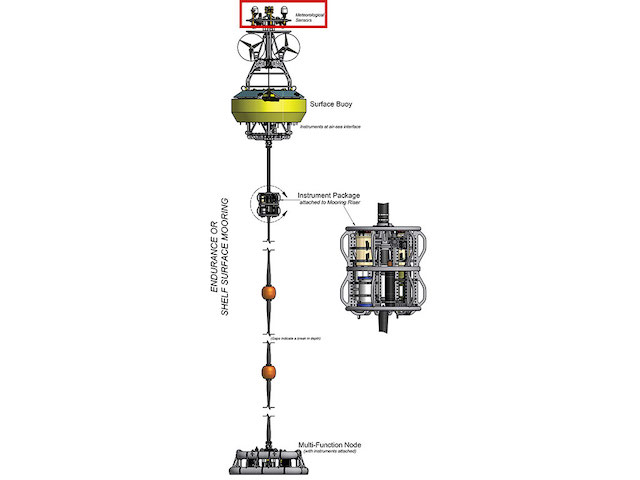
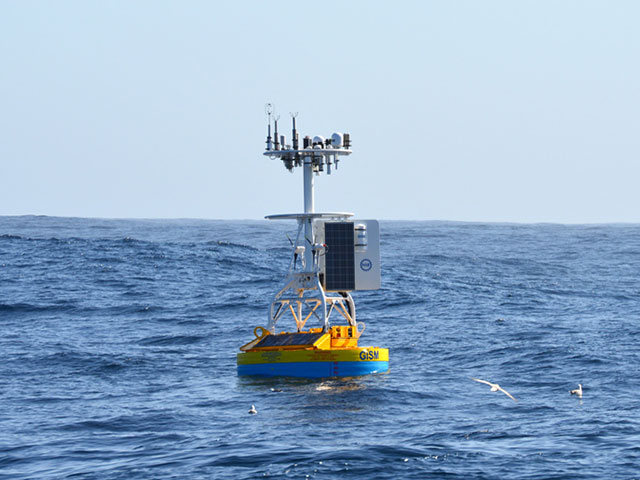
Click on the images below to learn more about where and how the dataset above was collected.
Dataset Information
The data for this activity was obtained from the following Bulk Meteorological instruments:
- Coastal Endurance, Oregon Shelf Surface Mooring (CE02SHSM-SBD11-06-METBKA000)
The above datasets were downloaded from the OOI data portal. Both telemetered and recovered datasets were used from each instrument to stitch together the best available dataset. Daily averages (means) of the temperature and salinity were calculated and the various datasets merged together into a single file. Daily precipitation was calculated by summing the calculated 15-minute rainfall measurements.
See this Jupyter Notebook for details on how the data for this activity was processed.
Activity Citation: Phillips, M., Helgers, K., Olney, J., Semcheski., M, & Lichtenwalner, C. S. (2019). Changes in Salinity. OOI Data Labs Collection.