Factors Affecting Primary Production - Instructor's Guide
Published March 9, 2020
Summary
These activities were developed to assist with students' understanding of how primary productivity varies throughout the year in the Southern Ocean, and examines how multiple abiotic factors correlate with primary production.
This collection consists of 2 sets of activities.
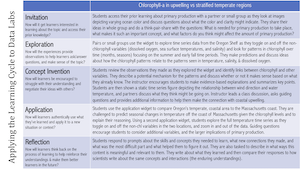
Part One is focused on the Concept Invention phase of the Learning Cycle. The Concept Invention phase introduces abiotic factors, including light levels, nutrient concentrations and temperature, that may influence primary productivity. This set of data includes a six-month period spanning July 2019 to October 2019 . Students are able to view patterns in primary productivity in conjunction with single abiotic factors to find patterns and make connections between the parameters.
Part Two is focused on the Application phase of the Learning Cycle. The Application phase prompts students to use the knowledge gained in the Concept Invention phase to predict how two abiotic factors will vary over a three year period of primary productivity data.
Learning Goals
After engaging with this Data Exploration a student will be able to:
- Interpret the provided data to describe patterns in individual data sets and correlations between the different sets of data (light levels, chlorophyll a, nitrate levels) shown on the graphs. Explain the relationship between primary productivity, nutrient concentration, light availability, and temperature in the Southern Ocean using evidence and relevant scientific concepts to support hypotheses.
- Describe the spatial and temporal variation in nutrient (nitrate) concentrations and explain possible causes.
- Predict how phytoplankton abundance will change based on changes in nutrient concentrations and available light
- Apply knowledge gained from a small subset of data to make predictions over longer time series and to support those predictions with a rationale.
Context for Use
These data explorations were designed for implementation in an introductory oceanography course (majors and/or non-majors). These activities would be appropriate for use in learning how to read graphs and interpret the data within graphs, as well as examining patterns of primary productivity in the Southern Ocean and understanding the abiotic factors that affect primary production.
Teaching Notes
Learning Cycle Sequence
Check out the suggested sequence of activities for this Data Exploration.
For an overview of this activity and additional tips, you can also check out the webinar recording.
Students will need to be familiar with concepts and terms from earlier in the semester including: the definition of primary productivity, use of chlorophyll a concentration as a proxy for primary production, nitrate is one of multiple nutrients required for primary production.
In upper division courses (300/400-level college courses) student knowledge may be enhanced with an introduction to how a fluorometer collects chl a data, the use of chl a as a proxy for primary production, and the caveats for this type of proxy. Students may also benefit from information on the different forms of nitrogen in the ocean and their bioavailability to different organisms. Students may want to explore variations in other nutrients, such as phosphate, that are not included in this dataset. Students' broader understanding of these concepts could be extended by looking at vertical profiles of these factors.
The Data Exploration activities require access to an internet-ready computer or tablet. Ideally each student group would have a computer or tablet to use to engage with the activity together. Alternatively, if no internet access is available for students, graphs of the specific time periods of interest and variables could be printed onto plastic overlays for each student or group of students.
Note, the Data Explorations use authentic raw data. Many of the datasets have been downsampled for simplicity and to ensure that the interactives load quickly in your browser. However, this means that many of the datasets retain their natural variability and some sampling side-effects. The goal of these activities is for students to analyze authentic data, not smooth averages. Effort has been taken to maintain as much of the data and to keep the variation of the data as true as possible, but make the activity user-friendly and browser-friendly.
Invitation: As an introductory activity, you can:
Consider doing one or more of the following to engage the students in the data activities to follow, to access their prior knowledge and make connections. These opportunities will also help to increase their interest in figuring out the interactions that explain patterns of primary production
- Prior to this exercise, explore general concepts of primary production using the Data Exploration focused on Primary Production in General. Students will make a concept map to brainstorm about how primary production varies across time and space and hypothesize which factors may covary across these scales.
- Tell students that the goal for this data activity is to help them come to a deeper understanding of: Primary production is affected by available nutrients.
- Have them talk in small groups to unpack that statement based on anything they can bring to the discussion from their prior knowledge, what questions they have, and what concepts they will need to learn more about in order to have a better understanding of the statement. (Some questions might include: What is primary productivity? How is it measured? What are available nutrients in the ocean? In what ways and how can nutrients affect primary productivity? How might seasonality affect nutrient availability? What other factors can affect nutrient availability?
- Record their ideas to return to later as they gain understanding.
- Spark students' interest by showing them a video clip of humpback whales bubble netting and lunge feeding. Ask them to respond to the following prompts:
- Describe (in small groups or partners) what they observe.
- What do they know about the whale's prey, what the food web might look like, what is supporting (at the base of) that food web, and what are all the things that might affect it?
- After they talk in small groups, you might tell them they have been discussing the scientific question: How do patterns in primary production impact higher trophic levels?
- Give students a pre-quiz to assess and to help them access their prior knowledge about the topic and concepts.
Exploration:
- Depending on student's prior knowledge and your teaching objective, have students (in pairs or small groups) use the widgets to explore variations in primary production:
- Across latitudes
- Within Climactic Zones - Temperate
- Within Climactic Zones - Polar
- Across a year at one location
- Inshore versus offshore
- After exploring the widgets, ask students which of their questions have been answered and what additional questions were raised for them by each of the widgets? What more do they need/want to know?
Concept Invention:
At the end of each exercise, once the students have had a chance to explore it and formulate answers to the questions, bring the class back together and ask them questions about what they discovered or learned.
- In small groups, have students discuss the factors they explored in terms of how and why they affect primary productivity, and what other factors may influence it.
- Direct the students or groups to predict how each of the factors vary across a year locally and then how they may vary in a Polar region.
- Have students in small groups/partners use the widget to examine and describe the relationships among nutrient concentration, light availability, temperature, and primary productivity.
- Lead students in a whole group discussion of their observations after the data activity, calling on students to provide the evidence that led them to their conclusion about the relationships. Ask others to add to their explanation or offer alternative evidence or conclusions.
- Ask, what questions still remain? What more information do we need to be more sure of our conclusions?
Application:
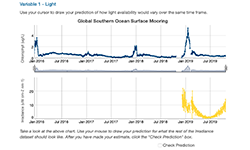
- Use the second widget to predict seasonal patterns of light availability and nutrient concentrations when given primary productivity data.
- Lead a class discussion about how their predicted patterns for nutrient concentration, light availability, and primary production compared to actual patterns.
- Have students extend their understanding of these relationships by drawing hypothesized seasonal patterns of abiotic factors at different latitudes. Ask students to predict how primary productivity would vary with these factors at each latitudinal range (tropics, temperate, polar).
- Students could also compare absolute magnitudes/ranges of the variables across different latitudes to get an idea of how these factors vary across the globe. Some satellite data could be incorporated to for example visualize an overview of the chl a. Advanced courses could cover the benefits/disadvantages of satellite versus fluorometer measures of chl a.
Reflection:
- Give students a post-quiz to assess how this exercise improved their knowledge of primary production. Have students compare their pre and post quiz results so they can see where their knowledge has improved.
- Have the students revisit their concept maps if they created one at the beginning of the exercise and have them make changes to reflect what they have learned in this activity.
- Pose some of these questions (possibly in a student survey): What new skills did you learn that helped you to figure out what was happening? What concepts did you need to learn more about in order to understand the graphs? What new connections between concepts did you make? In what ways did these connections help you to understand the concepts better? What was the most difficult part of this activity/unit/challenge for you? Why? What helped you to figure it out?
Subject / Topics
Introduction to Oceanography
- This exercise could have students revisit learned concepts, such as seasonal patterns in primary productivity, particularly in polar regions.
- This activity focuses on understanding which abiotic factors influence primary productivity in these regions.
- If these topics have not yet been covered, this example can provide the impetus to learn about them.
- This lesson also requires students to apply concepts learned to a new data set in order to gain a more complete understanding of the processes involved.
- More advanced students may be asked to apply concepts to a different region of the Ocean.
Grade Level
Undergraduate students in Introduction to Oceanography courses (for either marine science majors or non-science majors)
Data Scope
Our scope is exploring ways to use professionally-collected data in our teaching:
- Using professionally-collected data in teaching of concepts
- Visualizing data in a user-friendly and authentic way
- Enabling students to interactively engage with data in their learning to see the patterns as they are learning the why
Quantitative Skills
Most of the quantitative reasoning in this exercise revolves around reading and interpreting graphs.
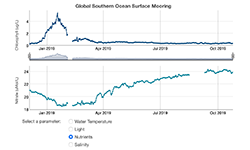
- Primary productivity is observed by interpreting a graph of chlorophyll a concentrations taken over the span of six months. Students are asked to read the graph to determine if there is a pattern.
- With the help of the widget, students will examine time series of primary productivity, nitrate concentrations, light availability and sea surface temperature. They should determine whether or not there is a correlation between any of the abiotic variables and primary productivity.
- With the help of the widget, students will predict seasonal patterns of light availability and nutrient concentrations when given primary productivity data.
Science Explanation
By examining the chlorophyll-a data, students should observe primary productivity is low in early December but increases throughout the month and into January. Chlorophyll-a levels peak in mid-January and decline to low levels by early February and stay low through the end of October 2019, when the last data was recorded. Many students will hypothesize temperature is the main factor affecting primary productivity. By using the data exploration and toggling on the temperature data, they should realize the chlorophyll-a peak in January occurs prior to the warmest water temperatures. Chlorophyll-a (as a proxy for primary production) in fact declines rapidly while temperature is still rising. Temperature, therefore, is not the main factor affecting primary productivity.
Students can then explore other factors that may impact primary production by selecting one parameter at a time to compare with chlorophyll-a. When students toggle on light, they should observe a slightly delayed correlation between increasing light levels in the summertime (December and January) that lead to a spike in chlorophyll-a, likely due to elevated primary productivity in the water from a phytoplankton bloom. When phytoplankton density is high, light penetration depth decreases because the phytoplankton chloroplasts absorb some wavelengths of the light and change the color the water. This in turn, could impact the sensor readings on the OOI instrumentation, showing decreased light levels during a bloom of phytoplankton. For students or researchers downloading the data from the OOI, this question could be explored further by examining specific wavelength ranges individually. Light levels continue to decrease after the bloom is over as this region in the Southern Ocean heads into winter and receives much less solar radiation.
By toggling on the nutrient levels, students should observe that nutrient levels are consistently high in high latitudes (polar regions) because year-round there is sufficient water column mixing due to winds, storm events, thermohaline circulation, and a general lack of a thermocline. When the chlorophyll-a levels peak in January, the exponential growth of phytoplankton populations causes a decrease in nutrients as the phytoplankton use the nutrients for growth and reproduction. Once the bloom of phytoplankton is over (primary productivity decreases), nutrient levels increase again.
To summarize, by working through this data exploration, students should understand the mechanism of how light and nutrient levels interact to facilitate primary production. Nutrient levels in surface waters are naturally high in high latitudes (polar regions) because the water column is well mixed, so phytoplankton populations are not nutrient-limited as they are in many regions the students may be familiar with. Light levels are low in high latitudes throughout the winter (June, July, and August in the Southern Hemisphere) but increase through the fall and peak in December. This increase in light triggers the growth of phytoplankton and causes primary productivity (as represented by chlorophyll-a concentrations) to increase and peak in January. The peak of primary productivity means there is a great deal of phytoplankton in the water that absorbs the light and uses up the nutrients in the water, so both light and nutrient levels decrease after the phytoplankton bloom. The depletion of nutrients along with the decreasing light levels as summer ends, causes the phytoplankton growth to slow and ends the peak in primary productivity in this region.