Factors Affecting Primary Production Application
Your Objective
Can you predict the pattern of light availability and nutrients based on the primary productivity data in the Southern Hemisphere Polar Pacific Ocean?
Explore the data below to see what you can observe about how primary productivity varies over three years.
Variable 1 - Light
Use your cursor to draw your prediction of how light availability would vary over the same time frame.
Take a look at the above chart. Use your mouse to draw your prediction for what the rest of the Irradiance dataset should look like. After you have made your estimate, click the "Check Prediction" box.
Variable 2 - Nutrients
Use your cursor to draw your prediction of how nutrient concentration would vary over the same time frame.
Take a look at the above charts. Use your mouse to draw your prediction for what the rest of the Nitrate dataset should look like. After you have made your estimate, click the "Check Prediction" box.
Unfortunately, due to an instrument issue, we do not have a complete record of nitrate data for this location. However, based on what you can see from the relationship between chlorophyll and nitrate for the periods where we do have data, can you explain your reasoning for your prediction?
Data Tips
When the site loads, the graph for Variable 1 - Light will show the chlorophyll a concentration dataset from the Global Southern Ocean Apex surface Mooring from December 2015 to October 2019. On the graph below, the light availability for December 2018 to October 2019 is also shown.
- Using your cursor to make a prediction of what the light availability data would look like from December 2015 to November 2018.
- Select "Show Actual Observations" to compare your predictions against the actual change in light availability data from December 2015 to November 2018.
When the site loads, the graph for Variable 2 - Nutrients will show the chlorophyll a concentration dataset from the Global Southern Ocean Apex surface Mooring from December 2015 to October 2019. On the graph below, the nutrient concentration for December 2018 to October 2019 is also shown.
- Using your cursor to make a prediction of what the light availability data would look like from December 2015 to November 2018.
- Since nutrient concentration data was not available for the selected time frame, check with your instructor for an estimation of the correct pattern.
Questions for Thought
- Notice the months and dates along the X-axis. Think about where this data was obtained.
- Which months are summer?
- Which months are winter?
- Describe the pattern of primary productivity for the time frame shown.
- Examine each data set based on the following:
- Primary Production (chlorophyll a)
- Nutrients (nitrates)
- Light (spectral irradiance)
- How did your prior knowledge of the relationships between primary productivity, light and nutrients inform your predictions of the missing data?
- How well did your predictions match the correct patterns?
- Describe some possible explanations for any discrepancies between the predicted and correct patterns.
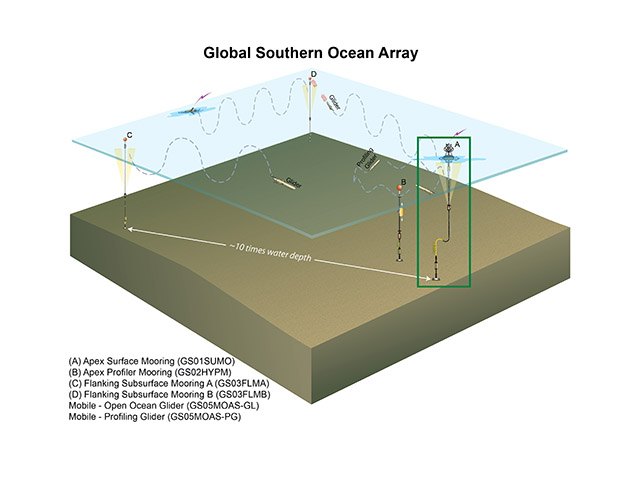
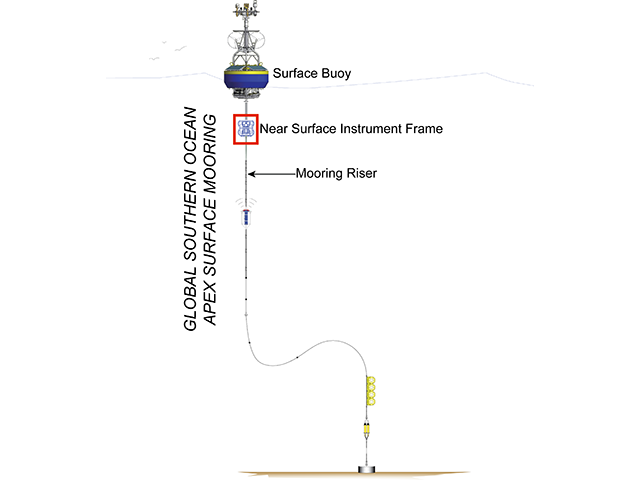
Background Information
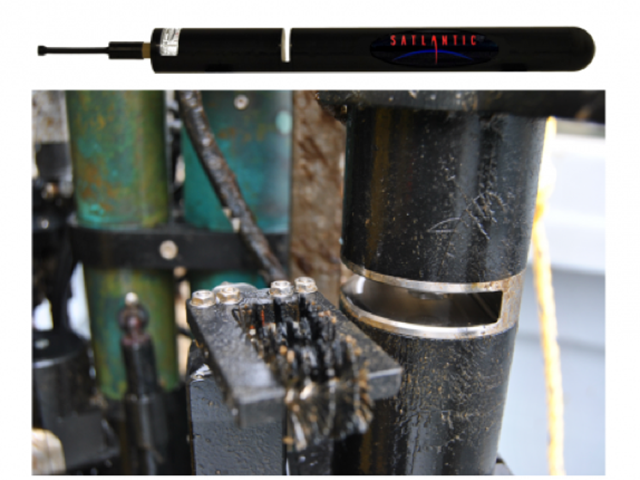
Click on the images below to learn more about where and how the dataset above was collected.
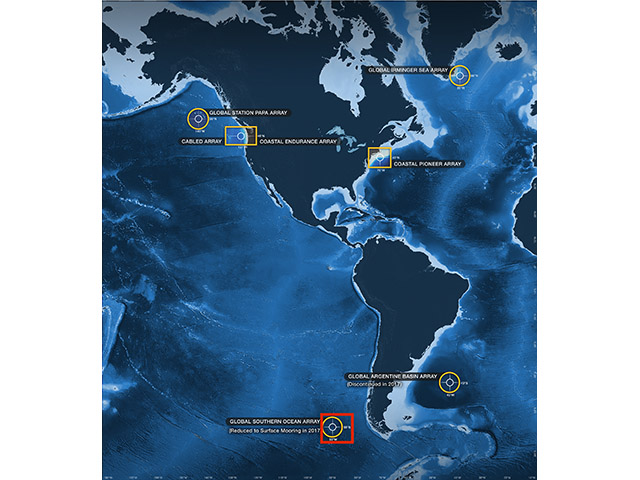
Dataset Information
The data for this activity was obtained from the following instruments on the Global Souther Ocean Surface Mooring.
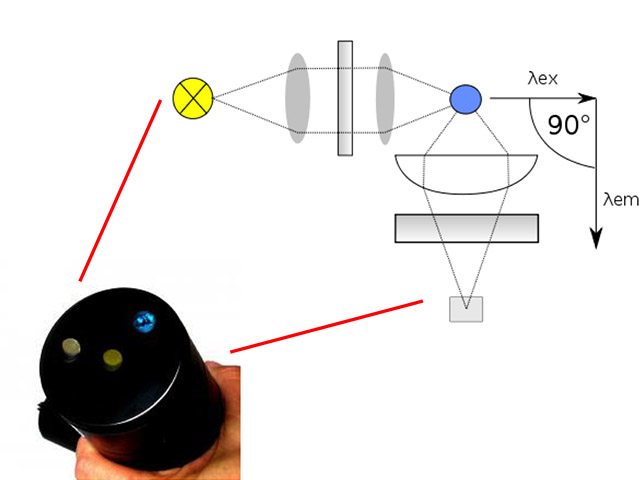
- Fluorometer (GS01SUMO-RID16-02-FLORTD000)
- Nitrate (GS01SUMO-RID16-07-NUTNRB000)
- Spectral Irradiance (GS01SUMO-RID16-08-SPKIRB000)
- CTD (GS01SUMO-RID16-03-CTDBPF000)
Telemetered datasets were downloaded from the OOI data portal, and then daily (mean) averages of temperature, salinity, chlorophyll-a, salinity-corrected-nitrate and downwelling spectral irradiance were calculated and merged together into a single file.
See this Jupyter Notebook for details on how the data for this activity was processed.
Activity Citation: Anastasia, J., DiSantis, D., Iacchei, M., & Lichtenwalner, C. S. (2020). Factors Affecting Primary Production. OOI Data Labs Collection.