Drivers of Seawater Density - Instructor's Guide
Published November 2, 2020
Summary
This activity explores three data sets consisting of density, salinity, and temperature from four different marine stations: Station Papa, the Coastal Endurance Array, the Coastal Pioneer Array, and the Global Irminger Sea Array. Pieces of the exercise can be used as appropriate for the instructor goals.
- Several ideas are given for having students access their previous learning on Temperature, Salinity and Density, or give students enough background knowledge to start the exercise (invitation).
- The tie-in to stratification in the ocean is quite compelling. Some data are presented and students are asked to draw some conclusions (exploration).
- Several types of data are presented, some as time series data with an interactive widget, and students are asked to speculate on the relationships between the Temperature, Salinity and Density (concept invention).
- After coming to a conclusion of the cause of the density variation students are challenged to apply what they have learned to another situation (application).
- This case requires students to reflect on the interaction between Temperature, Salinity, Density, Stratification, and Mixing, so at the conclusion students are asked to think about what they have learned about this complexity (reflection).
Learning Goals
Enduring Understanding: Whereas temperature typically controls density offshore in the open ocean, salinity plays a larger role in coastal waters.
Students who complete this unit will:
- Observe temperature, salinity and density data at three locations.
- Make a prediction and include a rationale about whether density is controlled by temperature or salinity
- Interpret the result of a numerical experiment using a data visualization
- Use evidence from the data visualization to describe how temperature and salinity control density in coastal and open ocean locations.
Context for Use
This exercise could be used for either lower level or upper level students depending on their depth of understanding of density variations. For an introductory course, the activity could be used to drive the concept of density in the ocean and how temperature and salinity influences it. For upper level courses such as a Physical Oceanography class, it might be a more stand-alone activity, where students can use this concept of variation of density and relate it to circulation, mixing, or even biological production in the ocean.
Teaching Notes
Students should be familiar with concepts from earlier in the course including: Temperature, salinity, density, thermocline, halocline, pycnocline and how these parameters vary with seasons and regions. However, the activity could also be used to introduce these concepts to be followed by instruction on salinity, temperature and density.
At any level, this activity requires synthesis of temperature, salinity and density concepts that may not have been considered together previously. While the hope is to guide students to the correct answer, the broader learning goal is in making these connections. The context of density changing with either temperature or salinity variation provides a motivation for students to make this effort. After the activity is over, discussion could center around the difference between onshore and offshore stations, how climate change might affect coastal and open ocean regions differently and how life in the ocean could be affected. Specifically, this activity provides the linkage between warming and freshening of the ocean and stratification.
Invitation: As an introductory activity, you can:
- Prior to the start of the exercise, ask students to briefly discuss with a partner or small group what they know about:
- the way that temperature, salinity and density vary with depth and/or vertical profiles of T, S, density and how they relate to each other,
- the concept of stratification and how it is influenced by density and mixing processes,
- Then ask groups to share their discussions to reveal the collective knowledge the class holds.
- Have students make a concept map about their prior knowledge relating temperature, salinity, density, stratification, and mixing. (They will revisit and revise the concept map later in the activity.)
- Ask students how they would expect these properties and processes would vary over the course of a year. This could occur as a think-pair-share activity, or as a larger group discussion as a prelude to looking at the data visualizations.
- Discuss how oceanographers measure salinity, temperature, and density. (Salinity is calculated from seawater conductivity. Temperature is measured using a thermistor. Density is calculated from temperature, salinity and pressure using a complicated formula called the Equation of State.)
- Introduce students to the three regions in the activity and ask them to consider whether similar processes will occur at these different locations. Ask them what they would need to know in order to answer the question.
- You might consider showing a video or demonstration addressing the concepts to get them interested in finding out more.
Exploration:
- Have students (preferably in pairs or small groups) examine the data sets from the three locations. And, based on the patterns they observe, make predictions and cite what evidence they are using to support their prediction about which factor (salinity or temperature) will be most important in determining density.
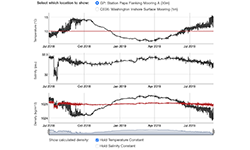
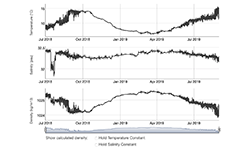
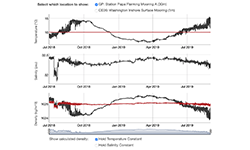
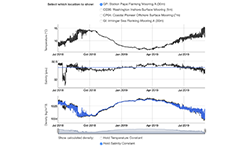
- Working in groups, have students use the widget to explore and perform the numerical experiment in which one parameter (temperature or salinity) is fixed at the mean value and density is recalculated. Students should discuss the results of the experiment and share their interpretations.
- At the end of the activity, student groups share their interpretation of the experiment with the rest of the class.
Concept Invention:
- Have students discuss (preferably with a partner or small group) how the three stations (locations) differed geographically as well as in terms of physical parameters and what factors led to these differences. Then lead a whole group discussion about their ideas and add information, clarify as needed. You might decide to share some of the following information if it doesn't arise from the student discussion.
- Comparing the three locations of this study. The Station Papa site is an open ocean location compared to the Coastal Endurance Array that is influenced by coastal dynamics of the ocean. The Global Irminger Sea location represents a more polar water mass where ice melt dynamics play an important role.
- Have students do a think-pair-share about how climate change might affect the three regions differently
- Station Papa is thermally stratified whereas Coastal Oregon is salinity stratified. The Irminger Sea is close to the sub Arctic, where ice melt is increasing
- Have students demonstrate their understanding (e.g. individual written explanation, drawing or other conceptual model, discussion with a partner, revise their original concept map) of the following concepts addressed in this experience to help them make meaning and realize where they still may have some missing pieces in their understanding.
- Compare and contrast the relative importance of temperature and salinity in influencing density stratification.
- Discuss the various processes that cause changes in temperature and salinity and hence density.
Application:
- Discuss the limitation of moored CTD observation versus a CTD profile in evaluating density variations.
- Consider the implications for marine productivity if temperature continues to increase and water becomes more density stratified, reducing mixing that brings nutrient rich waters to the surface. (May require some additional background either introduced here or prior to this exercise.)
- Consider what changes in stratification might occur with predicted changes to climate and human activities. (This may require some background either introduced here or prior to this exercise.)
- Students might be curious about why some of the seawater properties vary so much during certain periods. If appropriate, you can discuss the importance of the vertical distribution of these properties and the way the mixed layer depth fluctuates over time. Since the data are from fixed-depth moorings (at 7 m and 50 m), much of the variability is likely due to the mixed layer moving above and below the depth of sensors at certain times of the year. This is particularly evident in the Station Papa dataset.
Reflection:
Students revisit the concept map they created at the beginning of the activity. Based on their discoveries, students can revise the relationships between variables or identify which connections are most important in coastal waters versus the open ocean.
Ask the students to consider how they learned and how much they learned and applied their learning through one or more of the following:
- What new skills did you learn that helped you to figure out what was causing the observed density patterns?
- What concepts did you need to learn more about in order to figure out the relative importance of salinity versus temperature?
- What new connections between concepts did you make?
- In what ways did these connections help you to understand the concepts better?
- What was the most difficult part of this activity/unit/challenge for you? Why? What helped you to figure it out?
Subject / Topics
Introduction to Oceanography
Grade Level
Undergraduate students in Introduction to Oceanography courses (for either marine science majors or non-science majors).
Data Scope
Our scope in exploring ways to use professionally-collected data in our teaching by:
- Using professionally-collected data in teaching of concepts
- Visualizing data in a user-friendly and authentic way
- Enabling students to interactively engage with data in their learning to see the patterns and understand the concepts
Quantitative Skills
Two quantitative skills are used in this exercise.
- Reading and interpreting graphs:
- Students will observe correlations among variables in this dataset. There is also a clear cause-and-effect relationship between salinity and temperature (cause) and density (effect).
- Vertical profiles of temperature, salinity, and density are also provided from two stations. These profiles will provide some insight into why T, S, and density vary over time at the three stations.
- Interpreting the results of a simple numerical experiment: Students will need to infer the relative importance of the two factors (temperature and salinity) on density based on the results of an experiment in which students hold one variable constant and allow the other to vary.
For more information on using quantitative skills in higher education, please see: Teaching Quantitative Skills in the Geosciences
Science Explanation
TBD