Drivers of Seawater Density Exploration
Your Objective
Observe temperature, salinity, and density data from Station Papa.
- Make a prediction on whether temperature or salinity is more important in determining seawater density at this location.
- Test this prediction by observing how density changes when temperature or salinity is held constant at the mean value
Show calculated density:
Data Tips
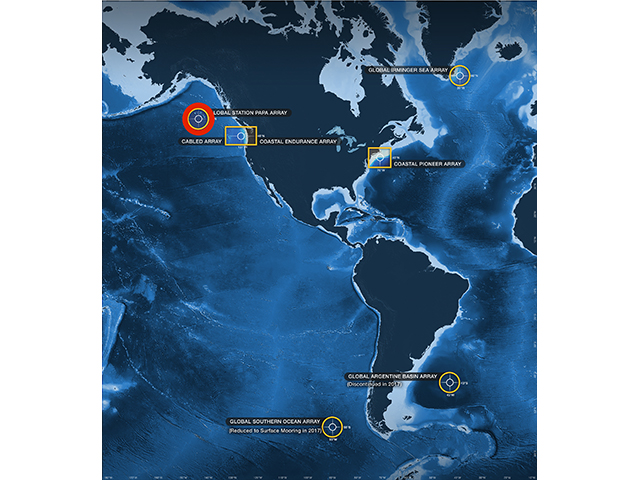
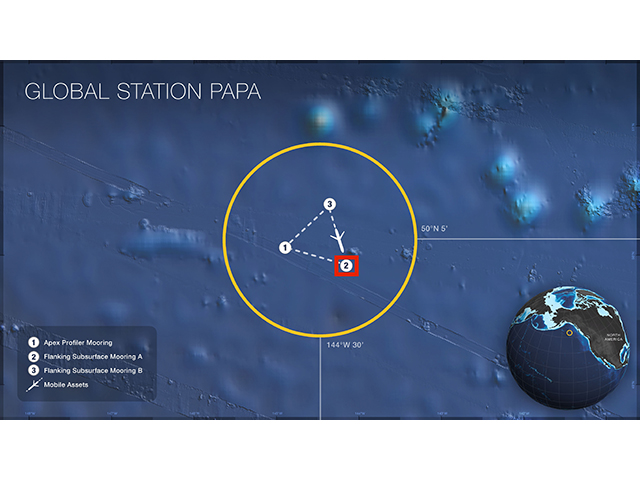
When the site loads, students will be able to observe plots of density, salinity and temperature from near near-surface moorings at three locations, Station PAPA in the North Pacific (30 m depth), Coastal Endurance array from the Oregon Coast (7 m depth), and the Irminger Sea (30 m depth). Students can interact with the data by:
- Zooming in and out of the data to look at different time scales that interest them by changing the width of the highlighted section of the bottom graph (it loads with all of the data highlighted).
- Toggling to hold either temperature or salinity constant at the mean value and observing the new calculated density in a different color.
Questions for Thought
- What oceanic variables can you observe in each plot?
- Locate the three stations on the map. How do they compare?
- Across what time periods were these observations made?
- During what time periods do temperature, salinity and density vary the most?
- During what time periods do they vary the least?
- Is temperature or salinity more important in controlling density?
- In the North Pacific (Station Papa)
- Off the Oregon Coast (Coastal Endurance Array)
- In the Sub-arctic Atlantic (Irminger Sea)
- During what time period did you see these changes or patterns?
- What might explain the differences between these stations?
Background Information
Click on the images below to learn more about where and how the dataset above was collected.
Dataset Information
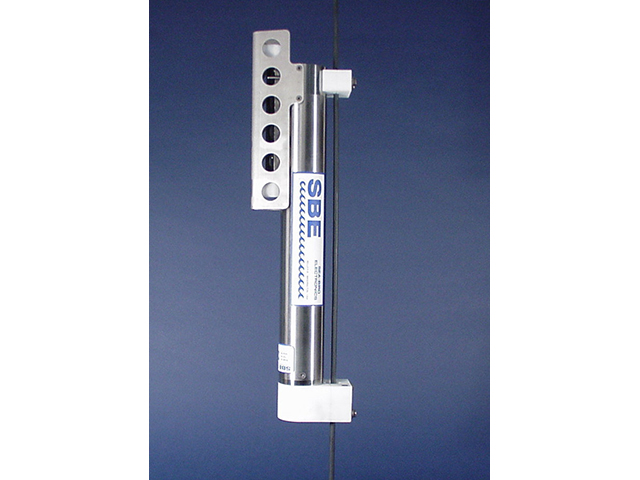
The data for this activity was obtained from the following CTD instruments:
Recovered datasets for each instrument were downloaded from the OOI data portal, and then averaged into 3-hour bins to create timeseries of temperature, practical salinity, seawater pressure and density. The Python Seawater Library was then used to calculate alternate densities, using the record mean values for temperature and/or salinity, which were also added to the final merged CSV file.
See this Jupyter Notebook for details on how the data for this activity was processed.
Activity Citation: Kumar, A., Rudio, K., Shull, D. & Lichtenwalner, C. S. (2020). Drivers of Seawater Density. OOI Data Labs Collection.