Drivers of Seawater Density Application
Your Objective
Observe temperature, salinity, and density data from four different locations.
- Make a prediction on whether temperature or salinity is more important in determining seawater density at each location.
- Test this prediction by observing how density changes when temperature or salinity is held constant at the mean value
Select which location to show:
Show calculated density:
Data Tips
Questions for Thought
Background Information
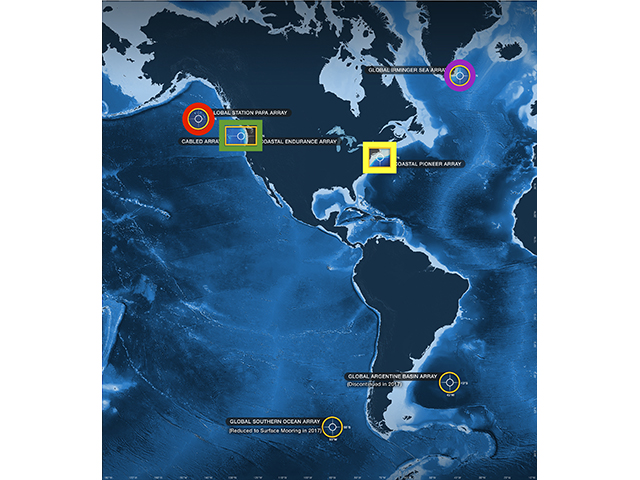
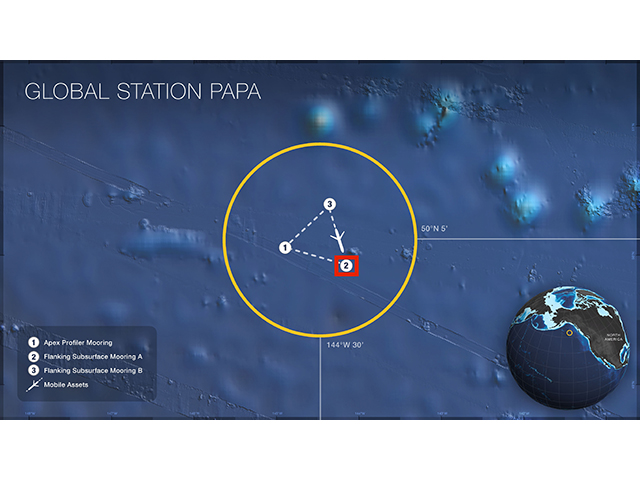
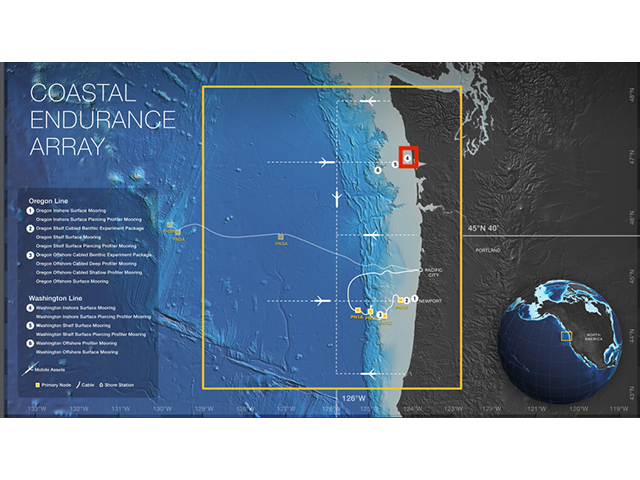
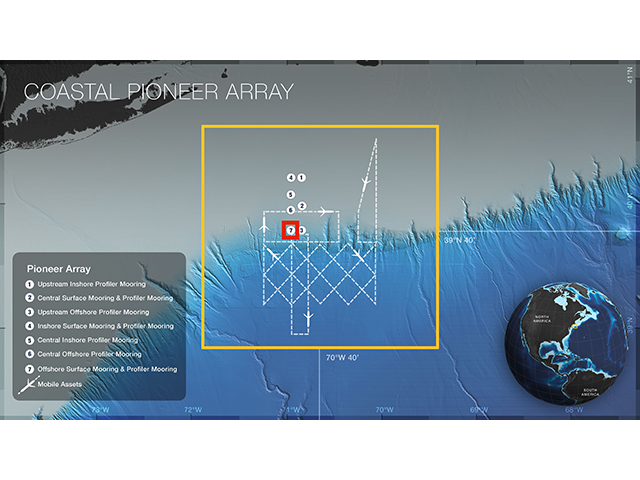
Click on the images below to learn more about where and how the dataset above was collected.
Dataset Information
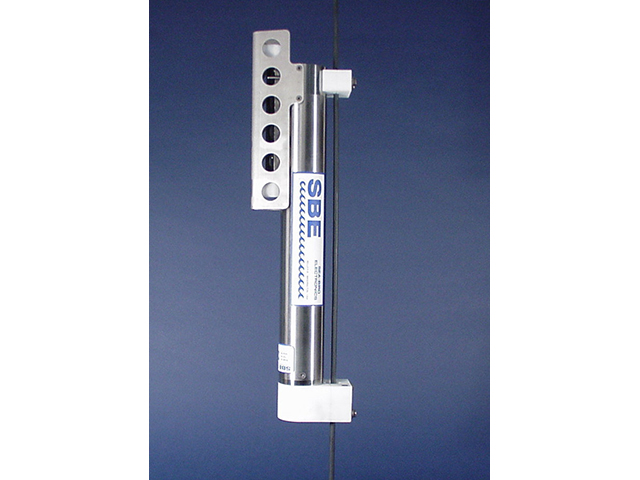
The data for this activity was obtained from the following CTD instruments:
- GP03FLMA-RIM01-02-CTDMOG040 - Station Papa Flanking Mooring A (30m)
- CE06ISSM-SBD17-06-CTDBPC000 - Washington Inshore Surface Mooring (1m)
- CP04OSSM-RID27-03-CTDBPC000 - Pioneer Offshore Surface Mooring (7m)
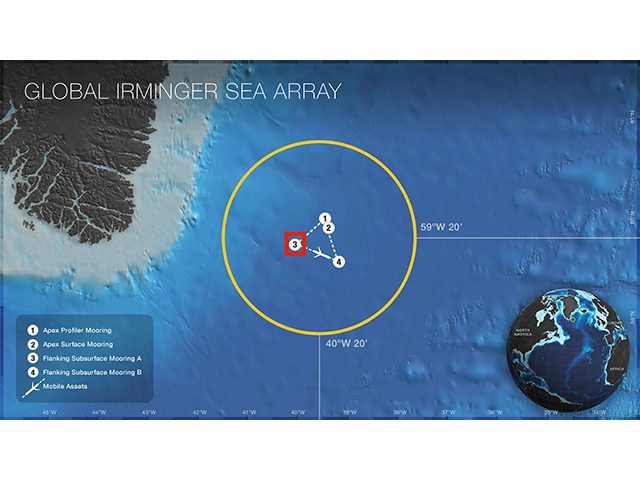
- GI03FLMA-RIM01-02-CTDMOG040 - Irminger Sea Flanking Mooring A (30m)
Recovered datasets for each instrument were downloaded from the OOI data portal, and then averaged into 3-hour bins to create timeseries of temperature, practical salinity, seawater pressure and density. The Python Seawater Library was then used to calculate alternate densities, using the record mean values for temperature and/or salinity, which were also added to the final merged CSV file.
See this Jupyter Notebook for details on how the data for this activity was processed.
Activity Citation: Kumar, A., Rudio, K., Shull, D. & Lichtenwalner, C. S. (2020). Drivers of Seawater Density. OOI Data Labs Collection.