Anoxic Events - Instructor's Guide
Published June 28, 2019
Summary
This exercise is a case study that, if used in full, takes students through the entire learning cycle from invitation to reflection as applied to a dead zone on the Oregon continental shelf. Pieces of the exercise can be used as appropriate for the instructor goals.
- Several ideas are given for having students access their previous learning on dead zones, or give students enough background knowledge to start the exercise (invitation).
- The tie-in to life in the ocean is quite compelling. Some data are presented and students are asked to draw some conclusions (exploration).
- Several types of data are presented, some as time series data with an interactive widget, and students are asked to speculate on the relationships between the wind and different water properties (concept invention).
- After coming to a conclusion of the cause of the dead zone students are challenged to apply what they have learned to another situation (application).
- This case requires students to reflect on the interaction between wind, circulation, water properties and biology, so at the conclusion students are asked to think about what they have learned about this complexity (reflection).
Learning Goals
After engaging with the Data Exploration a student will be able to:
- Describe patterns in individual data sets and correlations between the different data types presented
- Interpret the provided data
- Explain the relationship between wind direction and anoxic events on the Oregon Coast using evidence and relevant scientific concepts to support their conclusions.
Context for Use
This exercise could be used for either lower level or upper level students depending on the way it is set up and scaffolded. For an introductory course, the activity could be used repeatedly throughout the semester as a "challenge question" that is revisited as new knowledge is gained, resulting in final conclusions by the end of the semester. For upper level courses such as a Physical Oceanography class, it might be a more stand-alone activity late in the semester, although students may still need to be reminded of some of the background knowledge required to piece the story together.
Teaching Notes
Learning Cycle Sequence
Check out the suggested sequence of activities for this Data Exploration.
For an overview of this activity and additional tips, you can also check out the webinar recording.
Students will need to be familiar with concepts from earlier in the semester including: dead zones; dissolved oxygen, where it comes from and where we expect DO levels to be high and low; Ekman Transport; upwelling/downwelling and potential causes of these processes.
At any level, this activity requires synthesis of a variety of concepts that may not have been considered together previously. While the hope is to guide students to the correct answer, the broader learning goal is in making these connections. The context of dying crabs provides a motivation for students to make this effort. After the activity is over, discussion could center around how climate change affects the ocean, and how life in the ocean could be affected.
To help students understand aspects of anoxic events...
Invitation
- Prior to the start of the exercise, ask students to briefly discuss what they know about dead zones, either as a turn and talk or in response to a "clicker" question or an open ended question posed using a tool like polleverywhere.com. Either show their contributions or ask for them from groups to reveal the collective knowledge and their prior knowledge to both the instructor and other students
- Show the movie clip of dead crabs to raise interest in the problem.
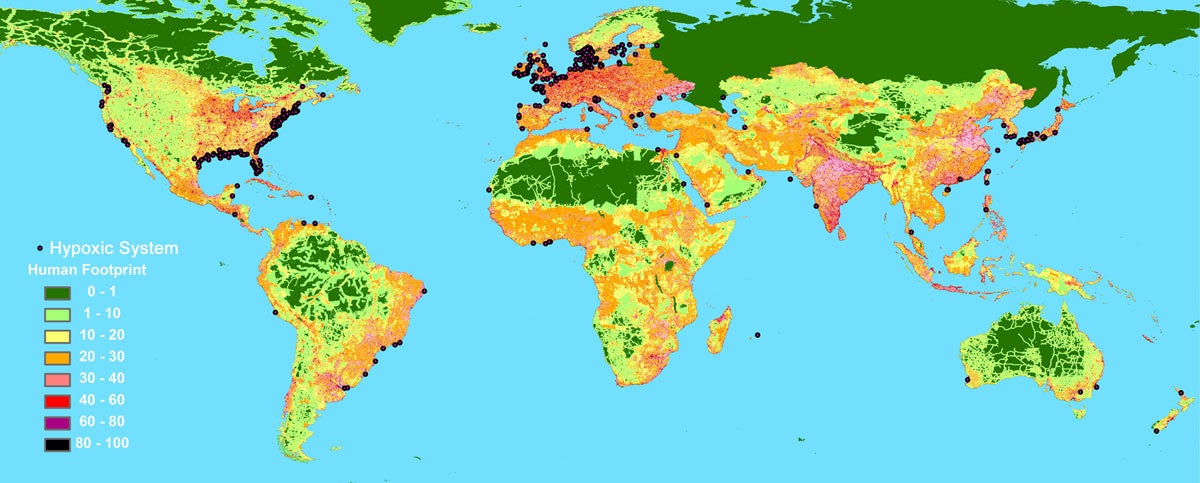
- Show a map of dead zones around the world, and if possible changes in occurrences of dead zones over time. Have students discuss with a neighbor what they know about dead zones. Have students share the results of their discussions with the class. Note to students that the phenomenon can have different causes even with the same result of mass deaths.
- Make a concept map about what causes dead zones using pencil or paper or electronic or online tool if you are familiar with one (e.g. CMAP)
- If used as a culminating activity, brainstorm with students what concepts and ocean/atmosphere processes might be relevant in explaining the occurrence of, and increase in dead zones
- If the case study will be revisited as each new relevant concept is addressed in the class, ask the students to build a log of analyses from one step to the next and be prepared to revisit it periodically.
Exploration
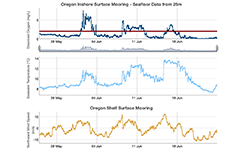
- Have students examine the dissolved oxygen record, summarize patterns they see in the data, and estimate the number of days in a month where organisms were likely stressed by low oxygen conditions. Then discuss whether the chemical changes might be a problem.
- Have students work in pairs or small groups to examine the plot of longshore wind speed and a map of the Oregon coast to make sure they understand how the graphical data translates to the geographical setting. Ask them to describe the different aspects of the visualizations and patterns in the data they detect. Then ask what questions they think they might be able to answer with this data. Do the patterns they identify reveal something about the setting that their prior knowledge might be useful to explain? Is there anything they are wondering about having studied the data that they might not yet be able to explain? What more information do they want or need?
Concept Invention
- Have students identify the link between dissolved oxygen and water temperature, and puzzle out whether or not it makes sense (reference). Then you could review and/or introduce some additional scientific concepts at this point to help students develop the understanding needed before the next step.
- Use the widget to examine and describe the relationship between wind direction, water temperature and dissolved oxygen concentration. Discuss correlations between these variables. (This video of Ekman transport generated upwelling may be useful)
- Show the students a vertical section of North Pacific dissolved oxygen concentration and have a discussion with them about the source of the anoxic water on the shelf.
- Show them an article about fishermen partnering with scientists to collect data and discuss what those datasets might tell us. (example article)
- With the combination of data, ask students to explain what processes are involved in deaths of crabs in this scenario.
Application
- Compare this anoxic area to another one. The Gulf of Mexico anoxia is largely due to fertilizers from agriculture. Include a discussion on natural versus anthropogenic dead zones. (reference)
- Compare this anoxic area to others around the world using Google Earth's Dead Zone layer (by World Resources Institute and VIMS). Discuss whether they might all be a result of the same processes used to explain the dead Oregon crabs.
- Examine a graph of wintertime wind direction and have students hypothesize on whether or not anoxia would likely occur in the winter. Then show dissolved oxygen data from the winter to see if their predictions were correct.
- Speculate on why low oxygen does not immediately correlate with a change in wind direction, but instead lags behind it.
- Consider the implications for marine fisheries if dead zones become more common. (May require some additional background either introduced here or prior to this exercise.)
- Consider what changes in dead zones might occur with predicted changes to climate and human activities. (This may require some background either introduced here or prior to this exercise.)
Reflection
- Revisit the concept map you created at the beginning of the exercise and make changes to reflect what you have learned in this activity.
- Have students reflect on the entirety of the case with a question like: Although we often study separately the different pieces of the ocean system, this case study nicely shows the interaction of the atmosphere (wind), ocean circulation (Ekman transport) and water properties (dissolved oxygen and temperature). As you tied together all of these pieces you learned something new about the ocean. What did you learn? How important was that learning to understanding the causes for the dead crabs?
- Ask the students to consider how they learned and how much they learned and applied their learning through one or more of the following:
- What new skills did you learn that helped you to figure out what was causing the anoxic zones?
- What concepts did you need to learn more about in order to figure out the mystery?
- What new connections between concepts did you make?
- In what ways did these connections help you to understand the concepts better?
- What was the most difficult part of this activity/unit/challenge for you? Why? What helped you to figure it out?
Subject / Topics
- Ocean currents: surface currents, upwelling/downwelling, Ekman transport
- Water chemistry: dissolved gases, gas solubility
- Biological processes involving oxygen
- Oxygen minimum layers, hypoxic/anoxic areas (dead zones)
- Marine fisheries
This exercise could be used to ask students to apply previously learned concepts, such as wind direction and Ekman transport and upwelling, to explain a real scenario. If these topics have not yet been covered, this example can provide the impetus to learn about them. It requires taking information in one form, mostly graphs, and conceptualizing about the Oregon continental shelf. In introductory classes, instructors may want to have students grapple with one or a couple of the concepts and fill in the details for them on the rest.
In more advanced classes students should be challenged to recall previously learned information and apply it to this problem. Instructors should be ready to jog their memories about the learned information.
Grade Level
Undergraduate students in Introduction to Oceanography courses (for either marine science majors or non-science majors)
This exercise can be a case study in upper level Physical Oceanography and Chemical Oceanography courses, where students apply what they have learned about dissolved gases, winds, Ekman transport and upwelling and downwelling.
Data Scope
Our scope in exploring ways to use professionally-collected data in our teaching by:
- Using professionally-collected data in teaching of concepts
- Visualizing data in a user-friendly and authentic way
- Enabling students to interactively engage with data in their learning to see the patterns as they are learning the why
Quantitative Skills
- Most of the quantitative reasoning in this exercise revolves around reading and interpreting graphs.
- Water quality is determined by interpreting a graph of dissolved oxygen concentration. Students are asked to read the graph to determine number of days oxygen concentrations are too low for marine organisms.
- Longshore wind speed and direction is presented in a graph and students must make the connection between the direction on a graph and the direction on a map of the study area. Understanding this is central to deriving Ekman transport and associated upwelling and downwelling.
- Students must examine a graph showing the relationship between oxygen saturation and water temperature to understand that the coupled temperature and oxygen data from the Oregon shelf are anomalous.
- They must also articulate patterns in the data presented.
- With the help of the widget students will examine time series of temperature, dissolved oxygen and alongshore wind speed. They should see that there is a strong correlation between all three of these variables
- A vertical section of deep ocean dissolved oxygen concentration provides the final bit of information needed to determine the source of the low dissolved oxygen water. Students need to examine this color contoured data product to determine where in the water column the low oxygen water resides.
For more information on using quantitative skills in higher ed, please see: Teaching Quantitative Skills in the Geosciences
Science Explanation
TBD