Anoxic Events Exploration
Your Objective
How do changing weather conditions and ocean circulation patterns affect our ability to fish for benthic organisms like crabs?
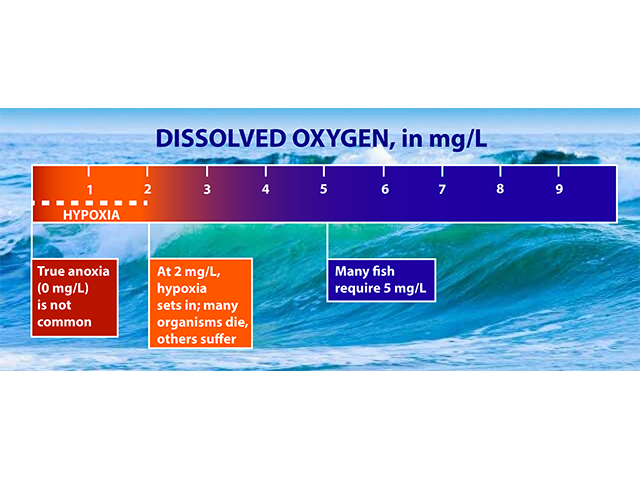
This dissolved oxygen data is from the seafloor (at 25m) at this location. Hypoxia occurs when dissolved oxygen (DO) values decrease below 2mg/L. Click the next button to show this threshold.
Data Tips
- By clicking on the Next button you can add more data sets.
- Examine the different data sets to see if they have similar patterns.
- Zoom in and out to see if changes in one type of data correlate with changes in another, or if there is a lag between the two. You can zoom by grabbing the sliders on the graph underneath the dissolved oxygen graph, or by clicking and dragging on either the temperature or wind speed graphs.
- Note that the wind data shows only that part of the wind parallel to shore. Positive values indicate wind blowing to the north, negative values to the south
Questions for Thought
- Examine each data set (wind direction, temperature, dissolved oxygen) and explore how it changes through time. What patterns do you see for each individual data set over the course of a month?
- Do you see any differences in how often these data vary?
- Compare two different times highlighted in each data set. How do the three parameters compare during these two different time periods?
- Using multiple data sets, make a prediction about how changing wind directions affect ocean circulation. How do these data sets support your prediction?
- Using multiple data sets, make a prediction about how changing ocean circulation affect conditions on the seafloor for organisms like crabs that live there. How do these data sets support your prediction?
- If you were a marine scientist working in Oregon, what would you want to tell the fisheries industry about the impact of weather on their ability to catch crabs?
- You identified some patterns in the data sets that can be correlated across the data sets. Do you see small differences in timing of correlations across some of the data? How can they be explained?
Background Information
Click on the images below to learn more about where and how the dataset above was collected, and to review dissolved oxygen in the ocean.
Dataset Information
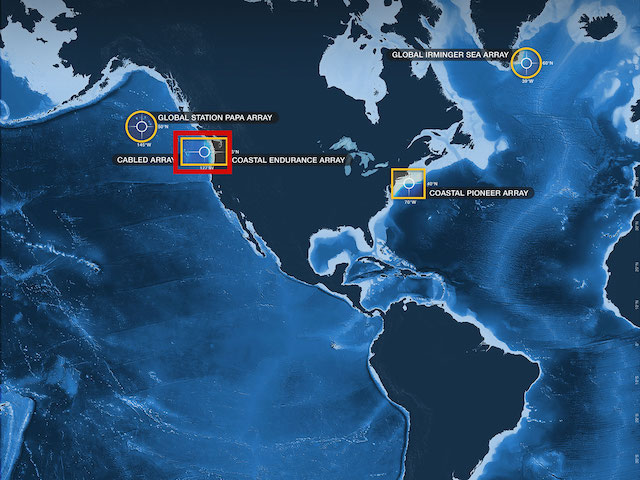
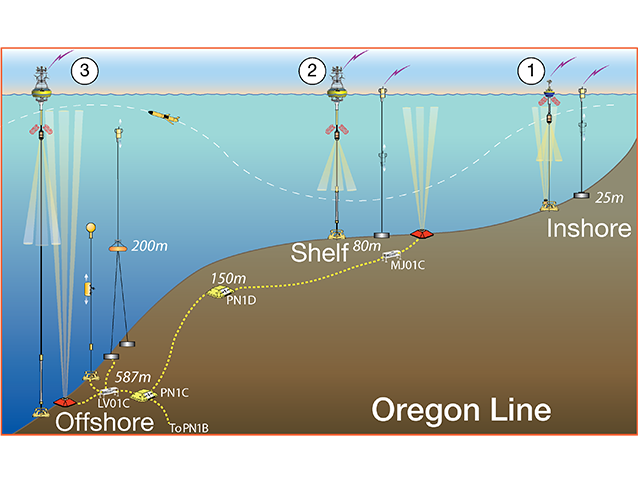
The data for this activity was obtained from the following Coastal Endurance instruments:
- Oregon Inshore Surface Mooring, Dissolved Oxygen @ 25m depth (CE01ISSM-MFD37-03-DOSTAD000)
- Oregon Inshore Surface Mooring, Seawater Temperature @ 25m depth (CE01ISSM-MFD37-03-CTDBPC000)
- Oregon Shelf Surface Mooring, Winds @ 3m above sea-level from the Bulk Meteorological Instrument Package (CE02SHSM-SBD11-06-METBKA000)
Recovered datasets for the above instruments were downloaded from the OOI data portal, and then averaged to hourly intervals before being merged and exported to CSV. In addition, DO was converted from micromole/kg (which is what the OOI system provides) to mg/L (which is what textbooks often use).
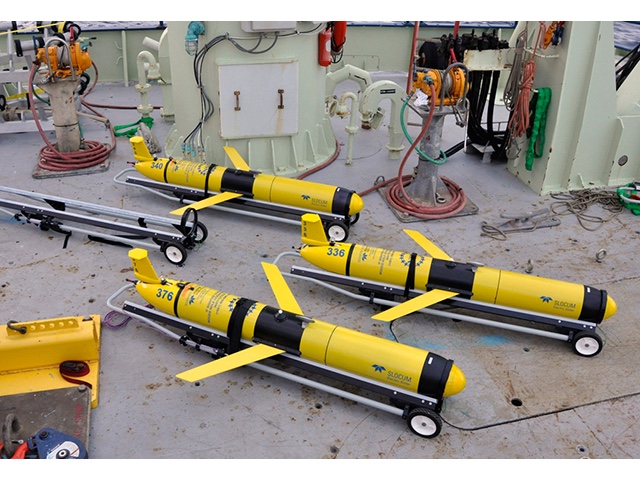
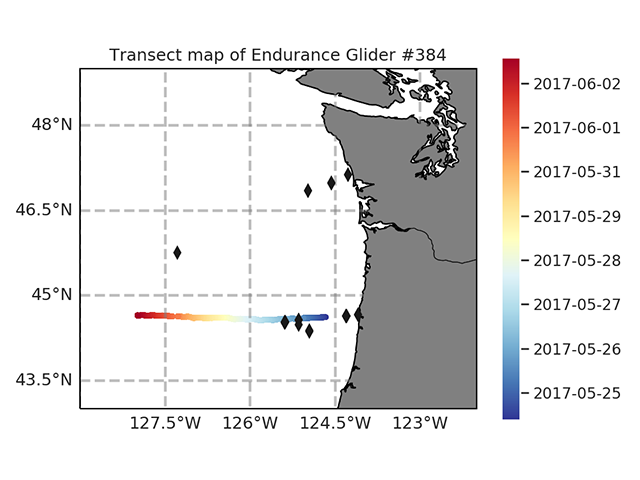
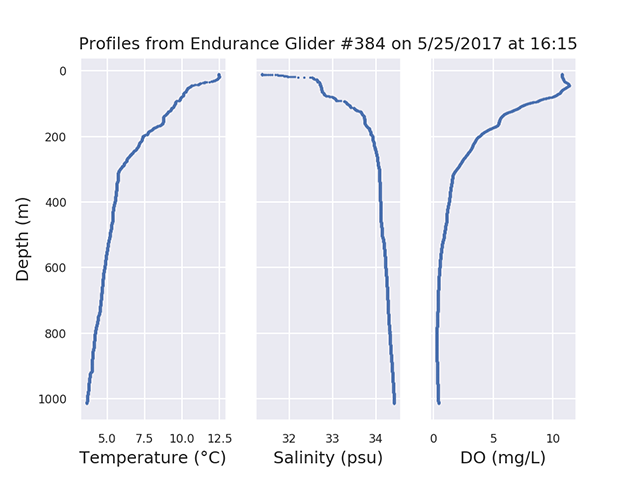
The Glider CTD and Dissolved Oxygen profile data shown in the background plots was collected by Endurance Coastal Glider #384, (CE05MOAS-GL384-04-DOSTAM000).
See this Jupyter Notebook for details on how all of the data used in this activity was processed.
Activity Citation: Browne, K., Sahl, L., Freeman, R., Smalley, G., White, C., & Lichtenwalner, C.S. (2019). Anoxic Events. OOI Data Labs Collection.