Geologic Features of a Seamount
Help students understand how seamounts are actively changing at mid-ocean ridges by working with seafloor and oceanic data at the Axial Seamount, North Pacific Ocean.
Select the question your instructor has assigned:
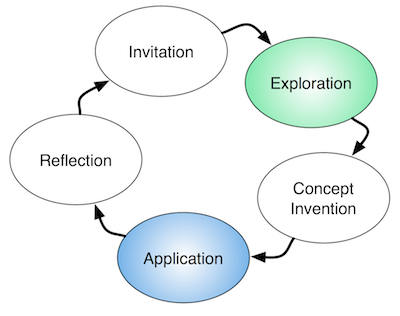
Exploration
Use depth and angle (tilt from side to side) data of the seafloor from 3 locations on the Axial Seamount in the Northeast Pacific Ocean (Cabled Axial Seamount) to look if there are patterns over 7 months in 2015.
Application #1 - Event-in-Detail
Use depth and angle (tilt from side to side) data of the seafloor, along with maps of the seafloor from the Axial Seamount in the Northeast Pacific Ocean (Cabled Axial Seamount) to determine if there are relationships over 4 days in 2015.
Application #2 - Event Impacts
Use depth and angle (tilt from side to side) data of the seafloor along with temperature data from the Axial Seamount in the Northeast Pacific Ocean (Cabled Axial Seamount) to determine if there are relationships around an eruption event.
