Impacts of Ocean Acidification on Shellfish in the Pacific Northwest - Instructor's Guide
Published February 16, 2020
Summary
This exercise is a case study that, if used in full, takes students through the entire learning cycle from invitation to reflection. Pieces of the exercise can be used as appropriate for the instructor goals.
- Students are invited to learn about the importance of shellfish aquaculture in the Pacific Northwest and how changing ocean conditions are threatening the success of the industry.
- The Challenge Questionf should be used to invite students to explore data and make predictions. (invitation)
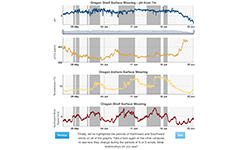
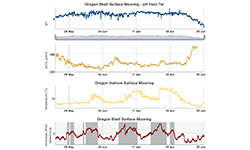
- Several types of data are presented, some as time series data with the interactive widgets, and students are asked to speculate on the relationships between the wind and different water properties (exploration).
- This guide provides background on important concepts, and several ideas are given for having students access their previous learning on pH, carbonate chemistry, and surface ocean circulation (concept Invention).
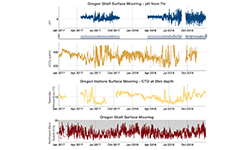
- After coming to a conclusion of the cause of the low pH surface waters, students are challenged to apply what they have learned to a longer data set (Application).
- This case requires students to reflect on the interaction between wind, circulation, water properties and biology, so at the conclusion students are asked to think about what they have learned about this complexity and identify concepts/topics they would like to learn more about (reflection).
Enduring Understandings
- The atmosphere, ocean physics, chemistry and biology are connected together.
- Changes in climate can affect human food sources.
Learning Goals and Assessments
Students will be able to:
- Describe and interpret patterns in individual data sets and correlations between the different data types presented (exploration)
- Write a figure legend for the first pH graph seen
- Write a figure legend for all four of the graphs together
- Explain the relationship between wind direction and pH on the Oregon coast, using data and relevant oceanographic concepts to support their conclusions.(exploration)
- Identify a time range in which upwelling is occurring
- Explain what is happening, including how and why the pH changes.
- Identify oceanographic conditions that negatively impact shellfish populations, and determine when those conditions are occuring. (application)
- Identify a time when conditions will negatively impact shellfish populations
- Draft an advisory to shellfish aquaculturists describing the problem, why it is occurring, and suggesting possible solutions.
Context for Use
This activity is applicable to lower and upper division courses. In lower division courses, this activity can be used to introduce basic concepts of ocean circulation and ocean acidification. For upper level courses, this activity could include a more in depth discussion of ocean circulation, climate, heat budgets, and how ocean acidification affects shellfish aquaculture industries.
Teaching Notes
This activity requires internet access on computers or tablets, preferably with no more than four students per device. If computer access is not available the graphs and activity questions may be printed ahead of time.
Before completing this activity, students should be familiar with pH, the dissolution of gases in water, and the basic concept of upwelling and Ekman transport. Preferably, students will have some background on buffers, shellfish life cycles, meroplanktonic vs. holoplanktonic life histories, and aquaculture, although this information can be provided during the activity as needed.
Invitation: As an introductory activity, you can:
Students share prior experience with shellfish, consumption and/or harvesting, and then discuss shellfish aquaculture. If aquaculture has not been previously discussed, a brief introduction could be added, with mention of locally aquacultured species.
- Class activity questions: Think/pair/share or clicker questions (free response/word cloud) or brainstorm, write on board. For larger classes, clicker questions are probably quickest option.
- What kind of shellfish have students eaten (relatives or seen others eat if allergic)?
- Where did their shellfish come from?
- Do they know the shellfish source?
- Pros and cons of aquacultured shellfish?
- Ecological/environmental, cultural, health (HAB contamination)
- Economic impacts
- Watch video: Supporting communities through ocean acidification research
Exploration:
- Give students 3-5 minutes to free write on what they know about ocean acidification. Students will use their free writes at the end of class to reflect on their learning.
- Complete the Exploration section of this activity. Have students complete the activity questions, then discuss as a group.
Concept Invention:
- NOTE: When discussing ocean acidification with students, it is important to be discuss the following:
- Why is it called ocean acidification when the pH of the ocean is basic?
- Why is it difficult for shell building organisms to build those shells?
- Concept of relative concentration of carbonate species and saturation (threshold) should be made clear to students
- Show students the image of pH found in Background section and remind students of the definition of pH, what it is a measure of, and that it is on a log scale.
- Pacific Marine Environmental Laboratories primer on pH
- Have students identify and explain the link between pCO2 and pH.
- Lab activities that allow students to explore the link between CO2 gas and the pH of a solution
- Show CO2 Time Series in North Pacific plot and ask students to describe trends of atmospheric CO2, seawater pCO2 and seawater pH, and explain why pH in seawater decreases as atmospheric and seawater CO2 increases.
- Have students create a list of the physical and biological factors that influence the pH of solution or seawater
- Ask students to explain why pH is important and how it influences life in the ocean
- Use the widget to examine and explain the relationship between wind direction and water temperature. Discuss correlations between these variables.
- Refer to NASA Ocean Motion website for description and images of surface ocean circulation
- This video of Ekman transport generated upwelling may also be useful
- Show diagram of coastal upwelling and plot of Coastal Upwelling Index found on the Northwest Fisheries Science Center website
- Show the students the vertical profile of pH with depth off the OR coast found in the Background section and have a discussion with them about the source of the low pH on the shelf.
- With the combination of data, ask students to explain how a change in the wind direction results in change in pH of surface water along coastal Oregon.
Application:
- Complete the Application section of this activity. Have students answer the questions and discuss as a group.
- Group discussion questions:
- Would you expect this same pattern on the east coast? Why or why not?
- Draw your prediction of nitrate levels over the time frame displayed in the pH graph. Why would you expect this trend?.
- Writing prompt: You are in a conversation with someone who claims it is good that the ocean absorbs atmospheric CO2 because it reduces greenhouse gases in the atmosphere. How could you convince them that they're wrong?
Reflection:
- Think of one part of this exercise that was confusing or challenging for you. Why was it challenging? What did you do to overcome this difficulty?
- Revisit the free write you completed earlier in class. Discuss how your knowledge of ocean acidification has changed. What would you be interested in learning more about?
- Ask the students to consider how they learned and how much they learned and applied their learning through one or more of the following:
- What new skills did you learn that helped you to figure out what was causing the low pH in surface waters?
- What concepts did you need to learn more about in order to figure out the connection between winds and the seawater properties?
- What new connections between concepts did you make?
- In what ways did these connections help you to understand the concepts better?
- What was the most difficult part of this activity/unit/challenge for you? Why? What helped you to figure it out?
Subject / Topics
- Atmospheric circulation: winds
- Ocean currents: surface currents, upwelling/downwelling, Ekman transport
- Water properties: temperature, pH, carbonate
- Biological: shellfish growth and lifecycle, primary production
- Low pH, ocean acidification
- Shellfish hatcheries, aquaculture
This exercise could be used to ask students to apply previously learned concepts, such as wind direction and Ekman transport and upwelling, to explain a real scenario. If these topics have not yet been covered, this example can provide the impetus to learn about them. It requires taking information in one form, mostly graphs, and conceptualizing about the Oregon continental shelf. In introductory classes, instructors may want to have students grapple with one or a couple of the concepts and fill in the details for them on the rest.
In more advanced classes students should be challenged to recall previously learned information and apply it to this problem. Instructors should be ready to jog their memories about the learned information.
Grade Level
Introductory oceanography class (100/200), majors or non-majors, probably later in semester rather than first day. Could be adapted to higher level class by using it as a case study and going into more detail.
Data Scope
Our scope in exploring ways to use professionally-collected data in our teaching:
- Using professionally-collected data in teaching of concepts
- Visualizing data in a user-friendly and authentic way
- Enabling students to interactively engage with data in their learning to see the patterns as they are learning the why
Quantitative Skills
- Reading and interpreting graphs
- Identifying patterns using real data
- Comparing graphs of different variables
- Connecting patterns across variables
- Applying graph interpretation to real world problems
For more information on using quantitative skills in higher education, please see: Teaching Quantitative Skills in the Geosciences
Expansion ideas
- Comparison of east coast/west coast
- Local aquaculture connections: hatchery/shellfish farm tours, guest speaker from hatchery/industry/extension (could do short videos to share)
- Local shellfish traditional ecological knowledge, tribal elders, retired citizens, etc. (could do short videos to share)
- Add other fisheries, food web ecological impacts, economic impacts Ex. Pink salmon juveniles consume pteropods, pteropods affected by low pH, pink salmon are commercially harvested species
- Tie in/very complementary to Anoxia exploration
- Have students use loopy (ncase.me/loopy) to make relationships with wind/upwelling/pH/anoxia
- Corrected/more accurate carbonate chemistry, differentiate between pH and dissolution/precip processes.
- Developing an asynchronous distance version
Science Explanation
TBD
Additional resources for instructors
- Washington Ocean Acidification Center
- Khan academy introduction to pH
- NOAA Pacific Marine Environmental Lab
- National Academies booklet on ocean acidification
- NOAA ocean acidification Diagram of carbonic acid and dissociation products
- National research council ocean acidification diagram
- Links to shellfish webpages:
- Background info on shellfish/ bivalves
- Northwest Fisheries Science Center
- Miguel's carbonate chem lecture