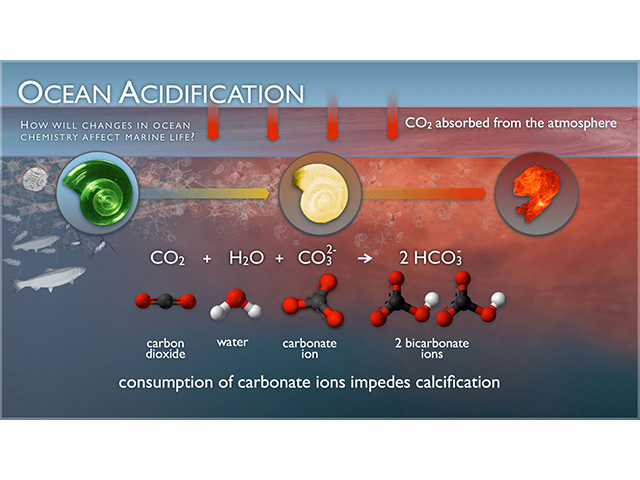
Impacts of Ocean Acidification on Shellfish in the Pacific Northwest Application
Your Objective
How does ocean pH affect survival of shellfish in hatcheries? Predict when coastal waters become harmful to shellfish.
Data Tips
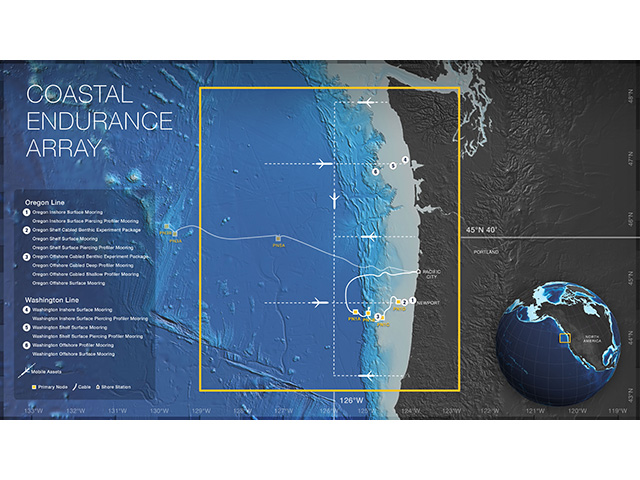
Datasets for this activity come from the Coastal Endurance Array Oregon Shelf Surface Buoy and Oregon Inshore Surface Mooring (see background section below for details about these locations and instruments).You can interact with the data by:
- Examine the different data sets to see if they have similar patterns.
- Zoom in and out to see if changes in one type of data correlate with changes in another, or if there is a lag between the two. You can zoom by grabbing the sliders on the graph underneath the pH graph, or by clicking and dragging sliders on any of the subsequent graphs of pCO2, temperature or wind speed.
- Note that the wind data shows only that part of the wind parallel to shore. Positive values indicate wind blowing to the north, negative values to the south
Questions for Thought
- Zoom into May - July 2017. What trends do you see in the data. Compare this trend to May - July 2018. Do the trends match? (NOTE: Need to check these date ranges and make sure the trend is clear)
- Zoom into January-December 2017, examine each data set (pH, seawater pCO2, temperature and wind direction) and explore how it changes through time. What patterns do you see for each individual data set over the course of a year? Compare to the data sets from January-December 2018. How are they similar or different?
- Examine each data set (pH, seawater pCO2, temperature and wind direction) and explore how it changes through time. What patterns do you see for each individual data set over the course of a year? Season?
- Using the temperature data, make a prediction about how changing wind direction affects ocean circulation. How do these data support your prediction?
- Using multiple data sets, make a prediction about how changing ocean circulation affects seawater pH. How do these data sets support your prediction?
- If you were a shellfish hatchery manager in the Pacific Northwest, during what time of year would you expect the highest oyster mortality?
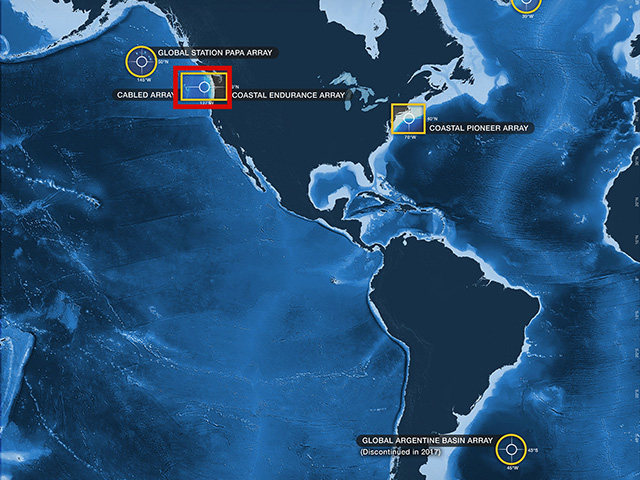
Background Information
Click on the images below to learn more about where and how the dataset above was collected.

Dataset Information
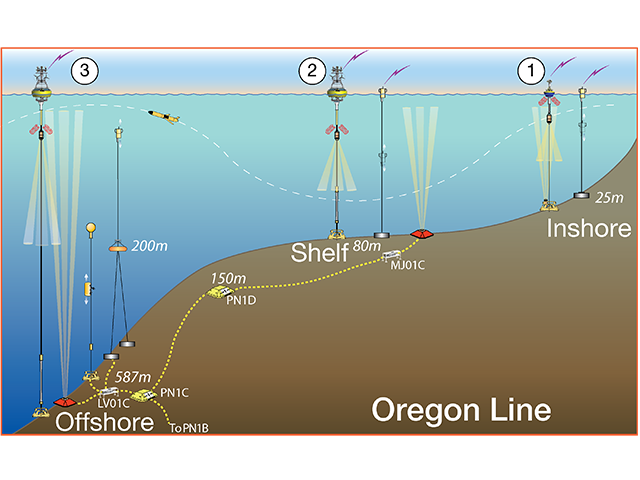
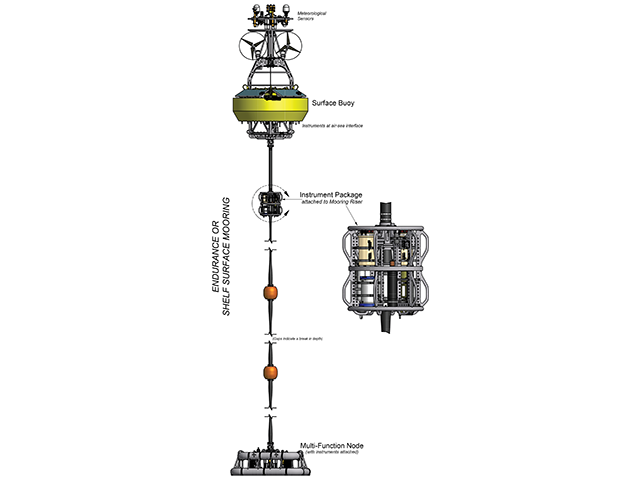
The data for this activity was obtained from the following Coastal Endurance instruments:
- pH (7m) @ Oregon Shelf Surface Mooring (CE02SHSM-RID26-06-PHSEND000)
- pCO2 (1m) @ Oregon Shelf Surface Mooring (CE02SHSM-SBD12-04-PCO2AA000)
- Seawater Temperature (25m) @ Oregon Inshore Surface Mooring (CE01ISSM-MFD37-03-CTDBPC000)
- Winds (3m above sea-level) @ Oregon Shelf Surface Mooring (CE02SHSM-SBD11-06-METBKA000)
Datasets were downloaded from the OOI data portal, outliers were removed, and then hourly (mean) averages of seawater pH, pCO2, temperature, salinity and wind speeds were calculated and merged together into a single file.
See this Jupyter Notebook for details on how the data for this activity was processed.
Activity Citation: Gerken, S., Greengrove, C., Nuwer, M., Smith, S., & Lichtenwalner, C. S. (2020). Impacts of Ocean Acidification on Shellfish in the Pacific Northwest. OOI Data Labs Collection.