Halocline Application
Your Objective
Use salinity data across a summer to determine if there are relationships in the depth and shape of the halocline over time between three different regions of the North Atlantic Ocean.
- Make a prediction about what differences in the location of the halocline you may observe across Temperate and Polar locations.
- Compare patterns in the data below to determine what and if there are relationships over time and/or space.
Data Tips
When the site loads, you are able to daily salinity profiles from June 1, 2015 from the Coastal Pioneer Array (Temperate Inshore & Offshore Shelf), with an empty graph for the Irminger Sea Array (Polar Deep Basin) as data are not available from June 1, 2015. You can interact with the data by:
- Selecting a different date to explore the data in ways that interest you by using the left/right arrows or moving the time slider box to the left or right.
- Seeing how the date your are looking at compares with all of the other data from the summer by selecting the "Show Context" button.
- Selecting to have the salinity or depth scales be the same across the two graphs, rather than determined by the available data (as it shows when the site loads).
As a note, each day graphs as a different color.
Questions for Thought
- How can you know what date the data are from that you are looking at in each graph?
- What is the overall range of salinity data you are able to observe in each graph?
- What is the overall range of depth data you are able to observe in each graph?
- What is the overall time range are you able to observe in each graph?
- What similarities and differences did you find in patterns of halocline depth over time between these Temperate Shelf and Polar Plain locations in the North Atlantic Ocean?
- What other questions do you have about patterns of changes in the depth of the halocline in the summer across the ocean from these data?
Background Information
Click on the images below to learn more about where and how the dataset above was collected.
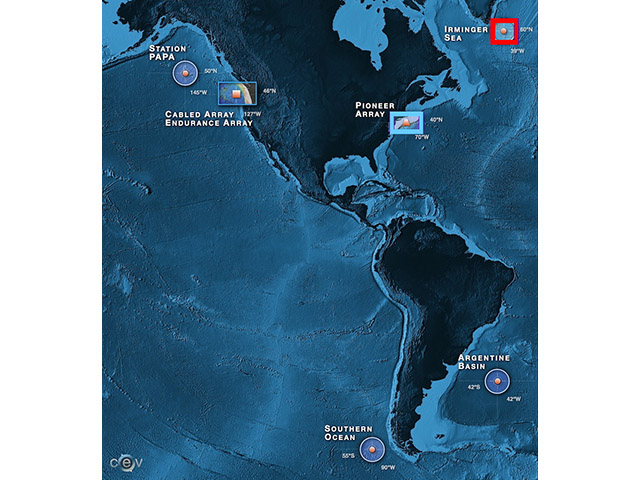

Dataset Information
The data for this activity was obtained from the following profiling CTD instruments:
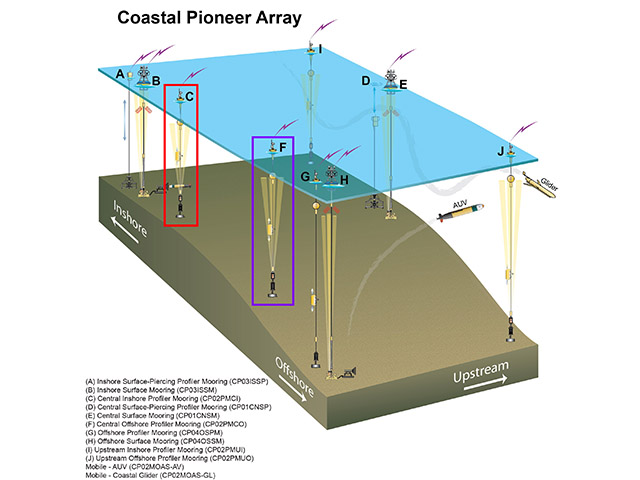
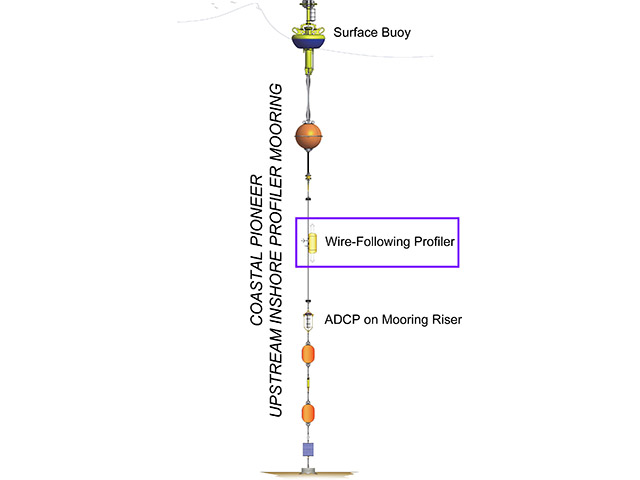
- Coastal Pioneer, Central Offshore Profiler Mooring (CP02PMCO-WFP01-03-CTDPFK000)
- Coastal Pioneer, Central Inshore Profiler Mooring (CP02PMCI-WFP01-03-CTDPFK000)
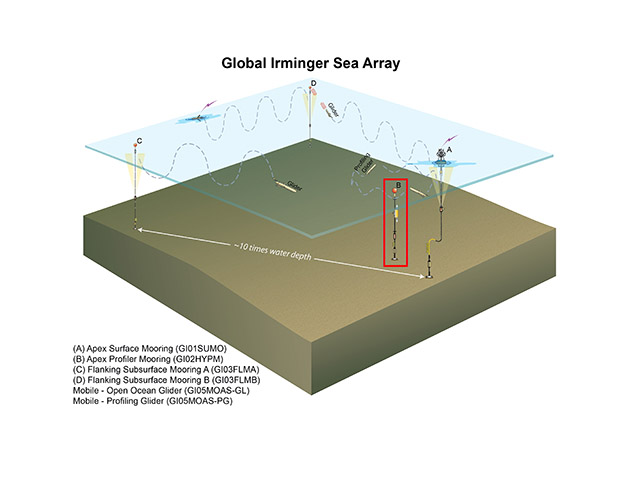
- Global Irminger Sea, Apex Profiler Mooring (GI02HYPM-WFP02-04-CTDPFL000)
The above datasets were downloaded from the OOI data portal. Complete profiles of the instrument were identified and the profile closest to midnight (GMT) each day was saved. This reduced the overall temporal resolution (and size) of the final dataset but it preserved the raw variability exhibited in individual profiles and measurements.