Changes in pH and pCO2 Exploration
Your Objective
Use pH and pCO2 data from the surface from the North Pacific Ocean to look if there are patterns over time.
- Make a prediction about what changes in pH at the ocean surface you may observe as pCO2 of the water changes over time.
- Explore the data below to see what you can observe.
Data is from October 7, 2015 to October 1, 2016.
Data Tips
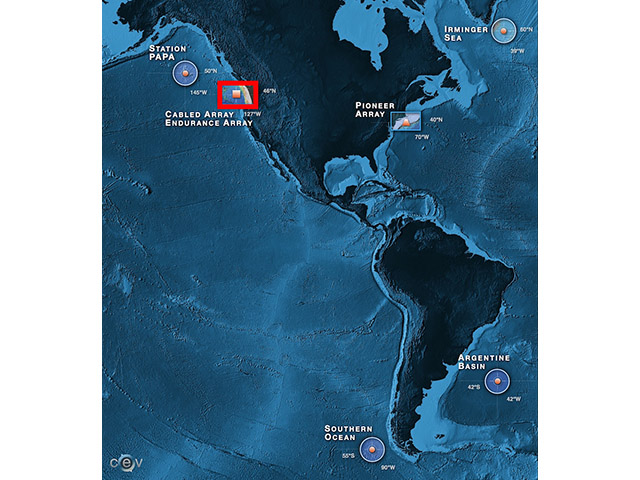
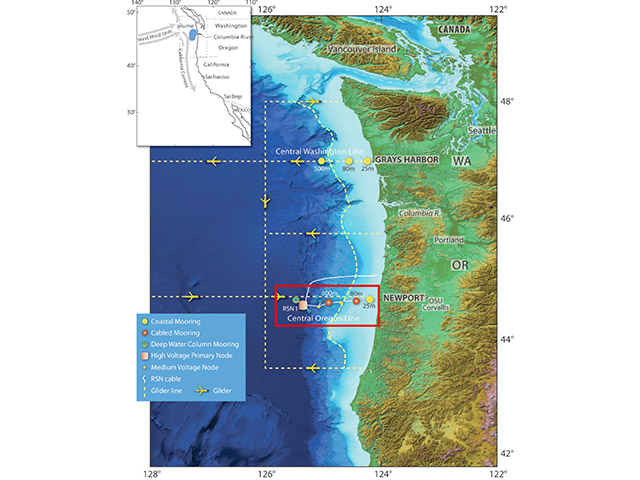
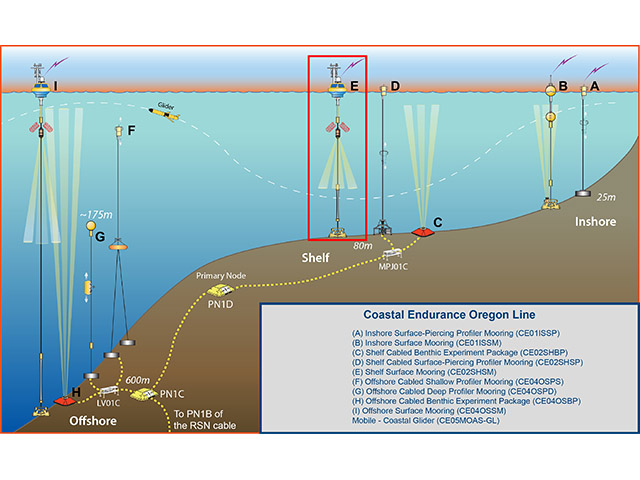
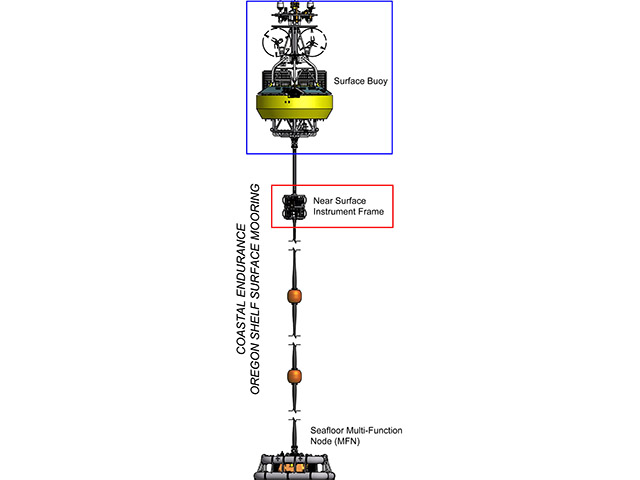
When the site loads, you are able to see a full year of pH and pCO2 data from the Oregon Shelf Surface Mooring, which is bart of the Coastal Endurance Array. On the right, you can see each variable plotted against time. On the left, the two variables are plotted against one another in a scatterplot. You can interact with the graphs in the following ways:
- Select a specific time period to explore that interests you by selecting a range of data in the pH graph (top right). Click to to draw a box over the data points. You can then move the highlighted box to the right or left.
- Zoom in and out of the data to look at different time scales that interest you by changing the width of your highlighted box section in the pH graph (top right).
As a note, the color denotes the time of year the pH data are from (light purple/pink are from the early part of the record, while blue/dark purple are from the later part.
Questions for Thought
- What is the overall range of pH data you are able to observe in this graph?
- What is the overall range of pCO2 data you are able to observe in this graph?
- What changes or patterns did you observe in the relationship between pH and pCO2 over this time period in the Northern Pacific Ocean?
- When did you see these changes or patterns?
- What questions do you still have about how pH and pCO2 are related?
Background Information
Click on the images below to learn more about where and how the dataset above was collected.

Dataset Information
The data for this activity was obtained from the following instruments:
- Seawater pH: Coastal Endurance, Oregon Shelf Surface Mooring (CE02SHSM-RID26-06-PHSEND000)
- Seawater pCO2: Coastal Endurance, Oregon Shelf Surface Mooring (CE02SHSM-SBD12-04-PCO2AA000)
The above datasets were downloaded from the OOI data portal, and then down-sampled to hourly intervals. The data presented are from the raw record, that is, they are instantaneous measurements that have not been averaged because that would smooth out the variability in the dataset.