Changes in pH and pCO2 Application
Your Objective
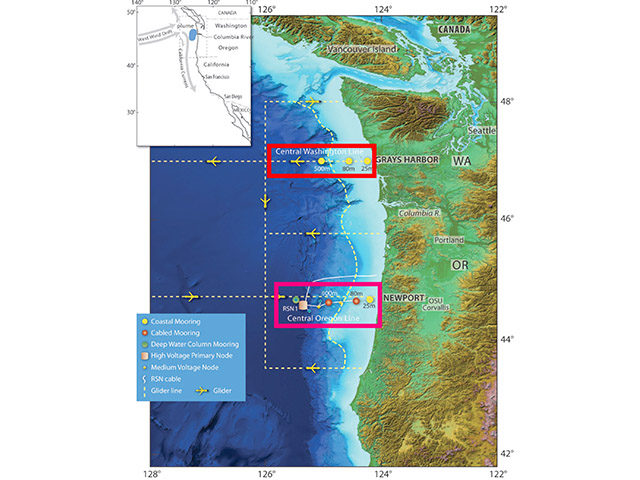
Explore data from the surface across different time periods from different areas of the Pacific Ocean - North (Coastal Endurance Array) and South (Global Southern Ocean Array) - to see what you can observe.
Select a Site:
Data Tips
Select different datasets from Washington (CE07) or off Chile (GS01) against the Oregon dataset (CE02). Drag the time slider to select a time period on the top right pH graph to compare changes in pH and pCO2 over time across all the graphs among the datasets. Select another time period on the top right pH graph, to explore the data in ways that interest you.
Questions for Thought
- What similarities and differences did you find in seasonal patterns in changes in pH and pCO2 across the Pacific Ocean?
- What can you conclude overall about seasonal patterns in changes in pH and pCO2 across the ocean from these data?
Background Information
Click on the images below to learn more about where and how the dataset above was collected.


Dataset Information
Data for this activity were adapted from the following instruments:
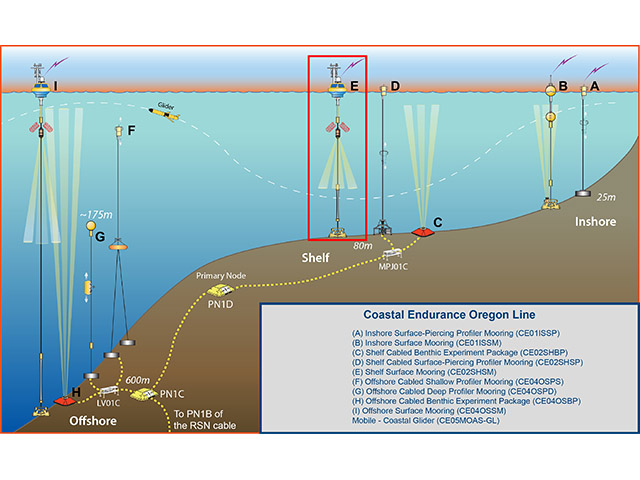
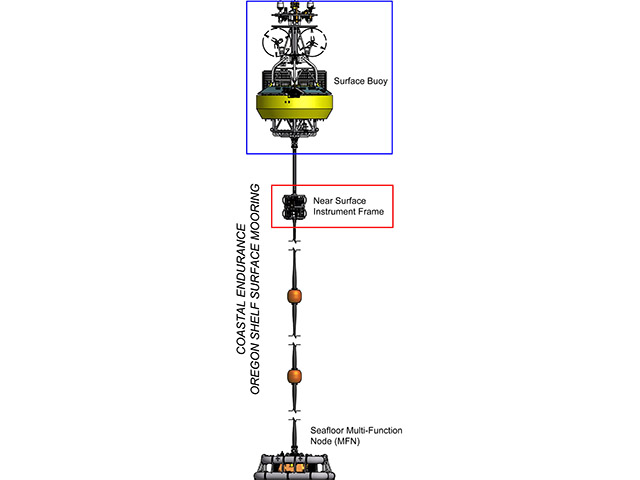
- Coastal Endurance, Oregon Shelf Surface Mooring
- Near Surface Instrument Frame, Seawater pH (CE02SHSM-RID26-06-PHSEND000)
- Surface Buoy, pCO2 Air-Sea (CE02SHSM-SBD12-04-PCO2AA000)
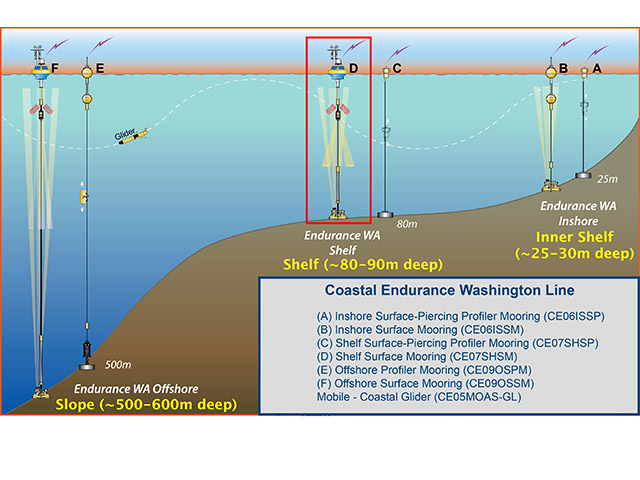
- Coastal Endurance, Washington Shelf Surface Mooring
- Near Surface Instrument Frame, Seawater pH (CE07SHSM-RID26-06-PHSEND000)
- Surface Buoy, pCO2 Air-Sea (CE07SHSM-SBD12-04-PCO2AA000)
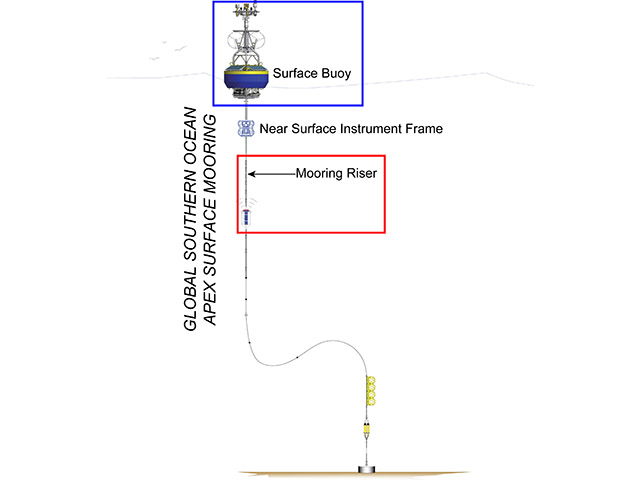
- Global Southern Ocean:
- Apex Surface Mooring, Mooring Riser, Seawater pH (100 m) (GS01SUMO-RII11-02-PHSENE042)
- Apex Surface Mooring, Surface Buoy, pCO2 Air-Sea (GS01SUMO-SBD12-04-PCO2AA000)