Changes in pH with Depth Exploration
Your Objective
Use pH data from the surface down to 200m from the North Pacific Ocean to look if there are patterns over a year.
- Make a prediction about what kind of changes or patterns in pH with depth may observe over a year.
- Explore the data below to see what you can observe.
Zoom to:
Data Tips
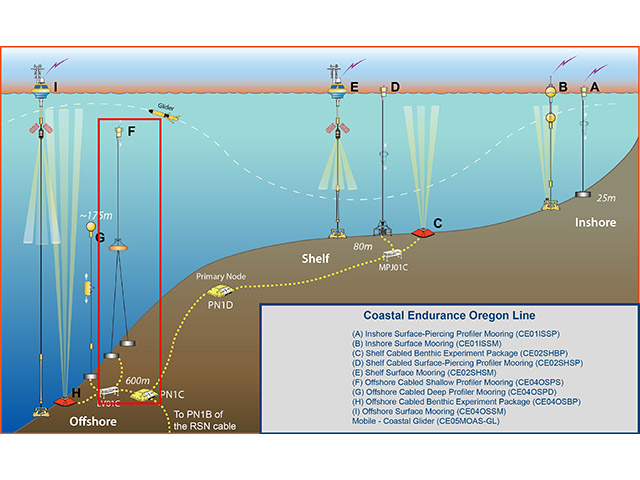
When the site loads, you are able to see pH data from the Oregon Offshore Profiler Mooring in the Coastal Endurance Array. You can interact with the data by:
- Selecting a different amount of time to look at by choosing between, 1 week, 2 weeks, or 1 month.
- Selecting a different part of the year to explore the data in ways that interest you by moving the highlighted section of the bottom graph to the right or left.
- Zooming in and out of the data to look at different time scales that interest you by changing the width of the highlighted section of the bottom graph to be more or less than a month.
The color denotes the time of year the pH data are from. January starts as light purple/pink and December ends as dark blue/purple.
Note, not all of the data may be accurate, as the sensor can become biofouled over time or other sampling issues.
Questions for Thought
- Across what time periods are you able to observe pH data in this graph?
- What is the first month and year there are data?
- What is the last month and year there are data?
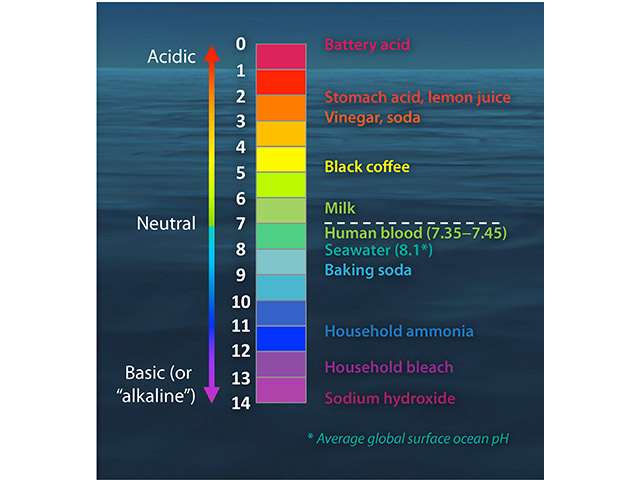
- What is the overall range of pH data you are able to observe in this graph?
- What changes or patterns did you observe in pH with depth over this time period in the Northern Pacific Ocean?
- When did you see these changes or patterns?
- What questions do you still have about changes in pH from the surface to down in the water column over time?
Background Information
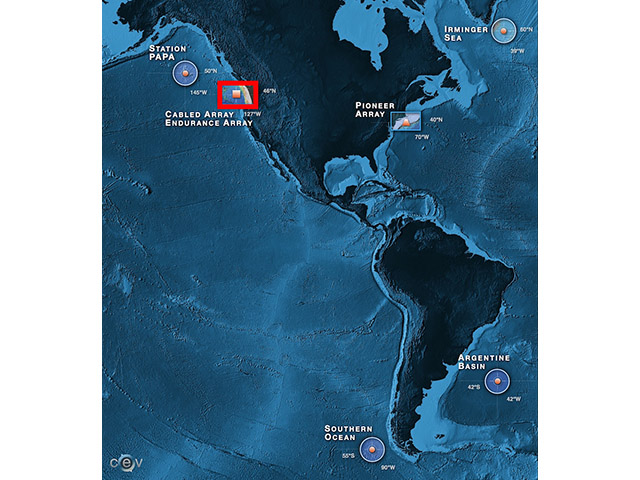
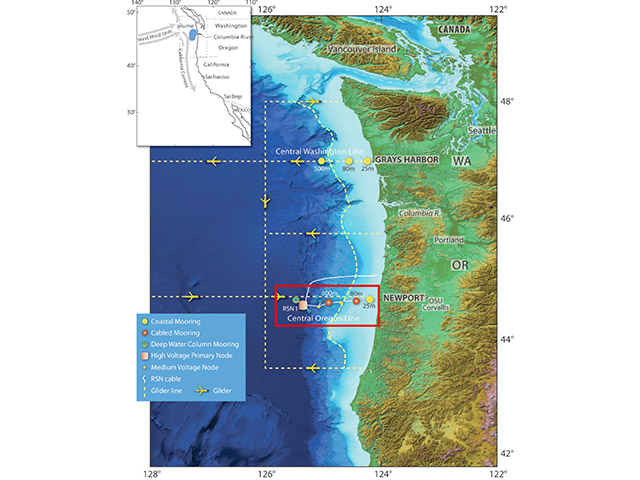
Click on the images below to learn more about where and how the dataset above was collected.
Dataset Information
The data for this activity was obtained from the following profiling pH instrument:
- Coastal Endurance, Oregon Offshore Cabled Shallow Profiler Mooring (CE04OSPS-SF01B-2B-PHSENA108)
The above datasets were downloaded from the OOI data portal. Complete profiles of the instrument were identified and the profile closest to midnight (GMT) each day was saved. This reduced the overall temporal resolution (and size) of the final dataset but it preserved the raw variability exhibited in individual profiles and measurements.