Seasonal Variation of Surface Salinity Application
Your Objective
Use salinity data across different time periods to determine if there are relationships over time across different regions of the ocean.
- Make a prediction about what kinds of changes or patterns in salinity over time you may observe across different parts of the ocean.
- Compare patterns in the data below to determine what and if there are relationships over time and/or space.
Select a season to zoom to see:
Choose a dataset:
Data Tips
When the site loads, you are able to see the full dataset of salinity data from the Inshore and Offshore sites of the Coastal Endurance. You can interact with the data by:
- Selecting which regional comparison you are interested in looking at: Inshore vs. Offshore, Atlantic vs. Pacific, or Northern vs. Southern.
- Selecting a different time period (season or full year) to explore the data in ways that interest you.
- Zooming in and out of the data to look at different time scales that interest you by changing the width of the by changing the width of the highlighted section of the bottom graph (it loads with all of the data highlighted).
Questions for Thought
- For each regional comparison, across what time periods are you able to observe salinity data in this graph?
- What is the first month and year there are data?
- What is the last month and year there are data?
- What similarities and differences did you find in patterns of salinity over time:
- Between inshore and offshore locations on shelf in temperate North Pacific Ocean locations?
- Between the Atlantic vs. Pacific Ocean in temperate northern hemisphere locations?
- Between Northern near-polar vs. Southern temperate in the Atlantic Ocean locations?
- What other questions do you have about variations in patterns of salinity over time across different parts of the ocean from these data?
Background Information
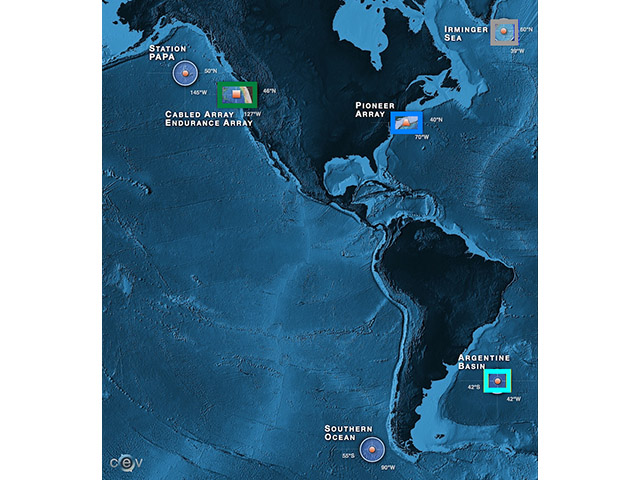
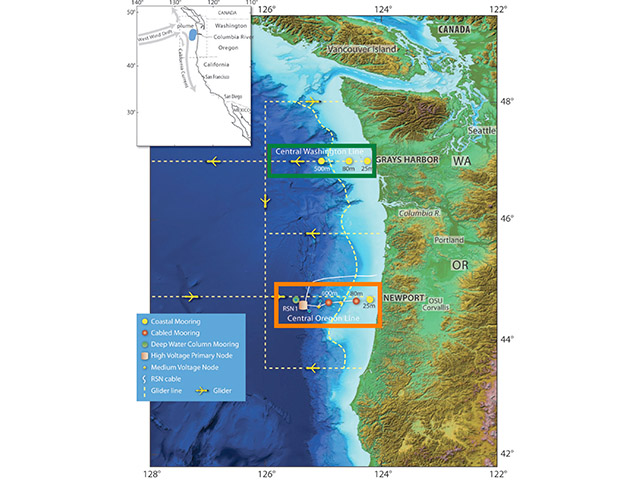
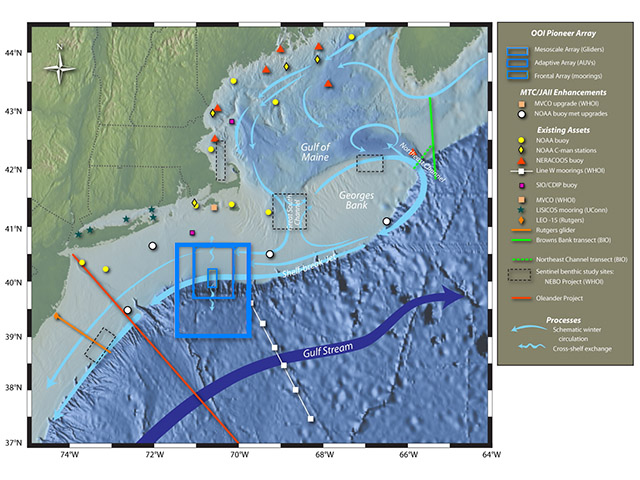
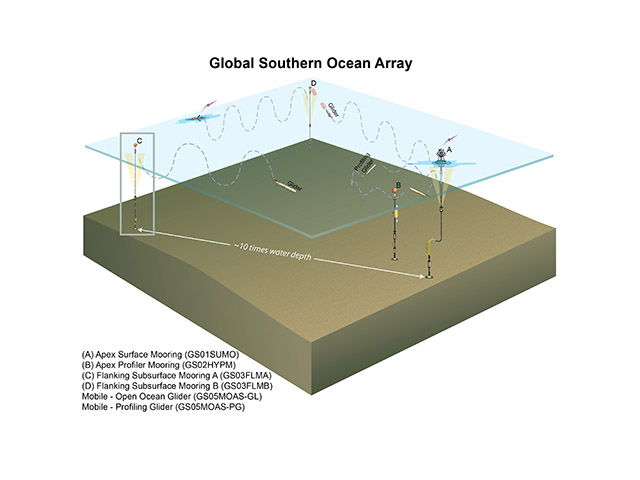
Click on the images below to learn more about where and how the dataset above was collected.

Dataset Information
The data for this activity was obtained from the following CTD instruments:
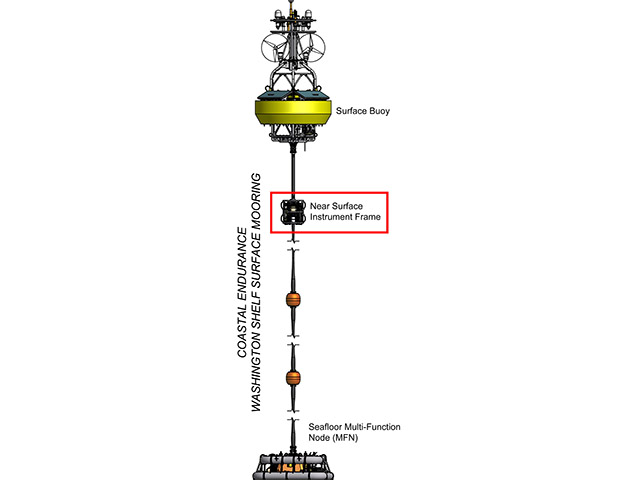
- Coastal Endurance, Washington Shelf Surface Mooring @ 7m (CE07SHSM-RID27-03-CTDBPC000)
- Coastal Endurance, Oregon Inshore Surface Mooring @ 7m (CE01ISSM-RID16-03-CTDBPC000)
- Coastal Endurance, Oregon Shelf Surface Mooring @ 7m (CE02SHSM-RID27-03-CTDBPC000)
- Coastal Pioneer, Inshore Surface Mooring @ 7m (CP03ISSM-RID27-03-CTDBPC000)
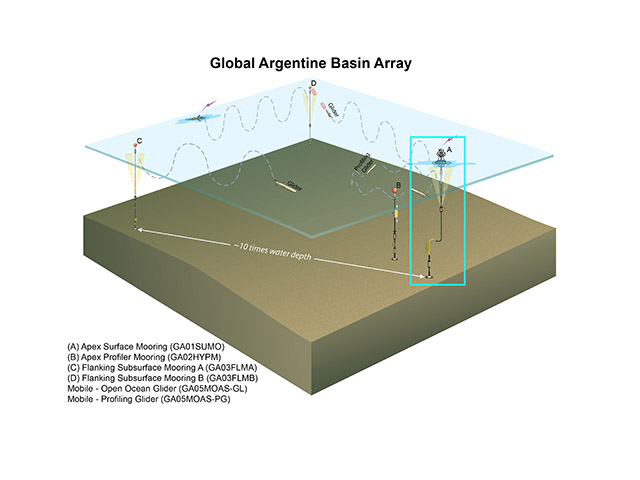
- Global Argentine Basin, Apex Surface Mooring @ 12m (GA01SUMO-RID16-03-CTDBPF000)
- Global Irminger Sea, Flanking Subsurface Mooring A @ 30 m (GI03FLMA-RIM01-02-CTDMOG040)
The above datasets were downloaded from the OOI data portal, and then down-sampled to hourly intervals. The data presented are from the raw record, that is, they are instantaneous measurements that have not been averaged because that would smooth out the variability in the dataset.