Profiles of DO and Chlorophyll-a in the Open Ocean Exploration
Your Objective
Explore how dissolved oxygen and chlorophyll-a change with depth, and how these patterns might relate to photosynthesis in the open ocean.
Data Tips
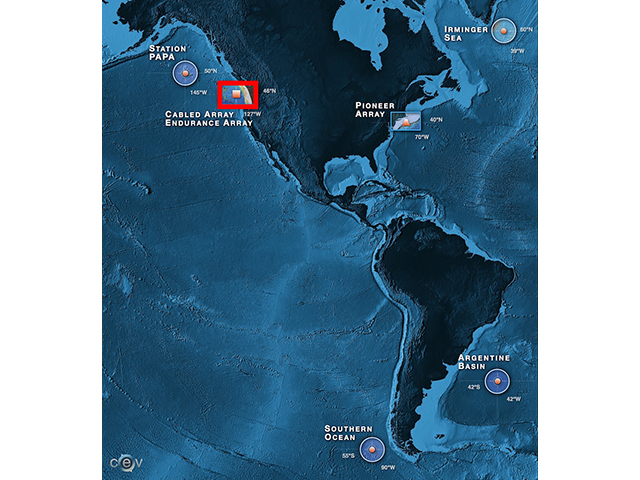
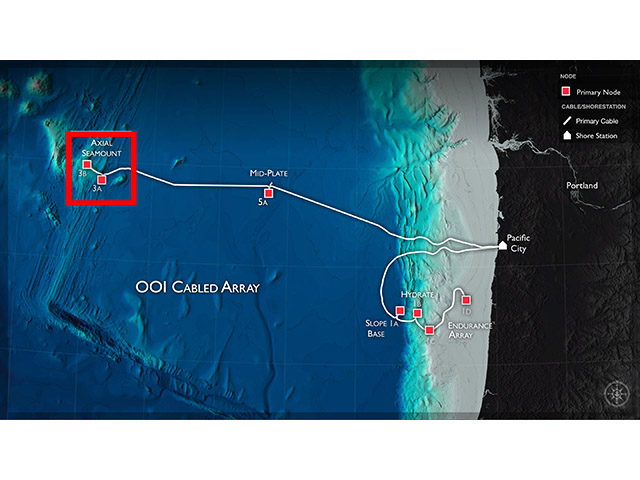
When the site loads there will be two blank figures which will show the full depth profiles of dissolved oxygen and chlorophyll a from the Axial Base Shallow Profiler, about 300 miles off the coast of Oregon. You can interact with the data by:
- Choosing two different variables to plot side-by-side in the 2 profile plots.
- Exploring how the 2 variables correlate in the right-most graph.
- Comparing changes in the parameters during different times of the year by selecting different months.
Questions for Thought
- Which variables are shown and what are the units used to describe them?
- At which depth(s) is dissolved oxygen at its minimum? Maximum?
- At which depth(s) is chlorophyll a at its minimum? Maximum?
- At which depth(s) do you see similarities or differences in the profiles of the two variables?
- Can you identify 2 distinctly different layers through the water column? Does the appearance or depth of the layers depend on the variable or time of year.
- What process(es) do you think are responsible for the observed relationship(s)?
Background Information
Click on the images below to learn more about where and how the dataset above was collected.
Dataset Information
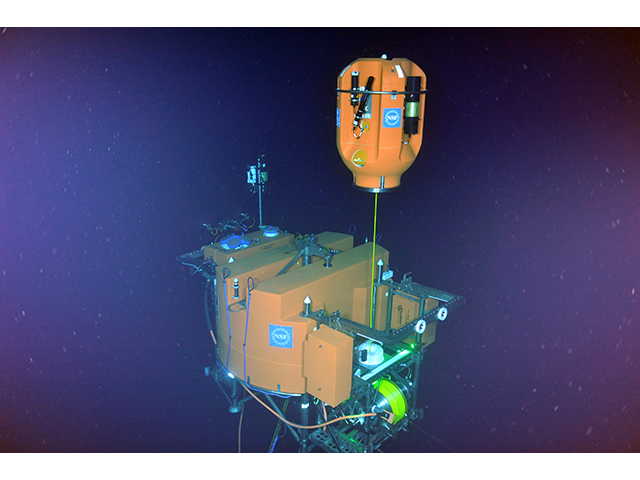
The data for this activity was obtained from the following instruments on the Axial Base Shallow Profiler Mooring:
- CTD & Dissolved Oxygen (RS03AXPS-SF03A-2A-CTDPFA302)
- 3-Wavelength Fluorometer (RS03AXPS-SF03A-3A-FLORTD301)
Streamed datasets were downloaded for each instrument from the OOI data portal, from the time period 2017-07-31 to 2018-07-03. These datasets were averaged into half-month profiles every 2m, and then merged into a single file for use in this activity. See this Python Notebook for details on how the data for this activity was processed.
Activity Citation: Anders, T., Long, J., Nuester, J., Weislogel., A, Williams, A., & Lichtenwalner, C. S. (2021). Profiles of DO and Chlorophyll-a in the Open Ocean. OOI Data Labs Collection.