Ecosystem Vertical Structure Exploration
Your Objective
Explore profiles of biotic and abiotic factors, to describe the vertical structure of ocean ecosystems. Biotic factors include chlorophyll and oxygen, while abiotic factors include light and temperature.
Select locations:
Select variables:
Select depth range:
Data Tips
When this page first loads, you will see profiles of 3 different variables from the same location. Take note of the variables displayed and the x and y axis limits for each. For example, the graphs will initially show only the top 50 meters of the water column.
You can interact with the full dataset by:
- Changing the depth range (y axis) to zoom to specific vertical regions, including the shallow/photic layer or the full measured profiles.
- Selecting different variables to display on each of the profile plots to compare.
- Choosing up to 3 different locations to include on the graphs. Each location is color coded.
Variable Descriptions
- Photosynthetically Active Radiation (PAR) is the measure of the density of photons per unit area that are in the spectral range of light (400-700 nanometers) that primary producers use for photosynthesis.
- Fluorometric Chlorophyll-a Concentration is an estimate of phytoplankton biomass using fluorescence. The fluorometer emits light at a specific wavelength that is absorbed by chlorophyll and re-emitted as light at a different wavelength. By measuring the intensity of the re-emitted wavelength of light the chlorophyll-a concentration in the surrounding seawater can be estimated. Chlorophyll-a concentrations can be used as a proxy for phytoplankton biomass as it is a dominant photosynthetic pigment.
- Dissolved Oxygen Concentration from the Stable Response Dissolved Oxygen Instrument is a measure of the concentration of gaseous oxygen mixed in seawater. This data product is corrected for salinity, temperature, and depth.
Questions for Thought
- Which variables are shown and what are the units used to describe them?
- How do oceanographers measure light, chlorophyll a and dissolved oxygen?
- At which depth(s) is PAR (light) at its minimum? Maximum?
- At which depth(s) is chlorophyll a at its minimum? Maximum?
- At which depth(s) is dissolved oxygen at its minimum? Maximum?
- At which depth does light disappear? Do you think it makes sense to use light sensors deeper than 200m?
- Why does light decrease with depth?
- Compare the chlorophyll values between the 3 profiles and describe the patterns you see.
- At which depths do the patterns of chlorophyll and dissolved oxygen match at each array? Where don't they match?
- Are there specific depths where the variables change rapidly?
- At which depth(s) do you see similarities or differences in the profiles between the variables?
- Why do the chlorophyll levels vary with depth?
- How do abiotic factors impact ocean ecosystems (for example, why is light important for life)?
Background Information
Click on the images below to learn more about where and how the dataset above was collected.
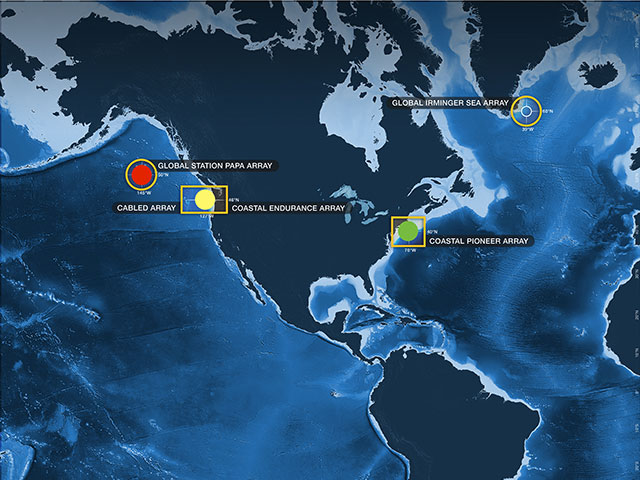
Dataset Information
The data for this activity was obtained from the following instruments and locations. Click the column and row headers for information on each instrument or location. Click on the icons to go to the OOI data portal.
| CTD & Dissolved Oxygen | PAR | Fluorometer | |
|---|---|---|---|
| Global Papa Glider 575 | |||
| Oregon Slope Base Shallow Profiler Mooring (2,906m) | |||
| Pioneer Upstream Offshore Profiler Mooring (452m) |
Recovered datasets from 2 days after 2018-08-01 for the Oregon and Pioneer locations, and 2016-07-01 for the Papa Glider were downloaded for each instrument from the OOI data portal. The profiles were then averaged into 20m bins and then merged into a single file for use in this activity.
You can check out this Python Notebook for more information on how the data for this activity was processed.
Activity Citation: Navarro, M., Tuaillon, C., & Lichtenwalner, C. S. (2021). Ecosystem Vertical Structure. OOI Data Labs Collection.