Data Activity 4C Comparing Regional Chlorophyll Patterns Around the World Application Data Activity
Your Objective
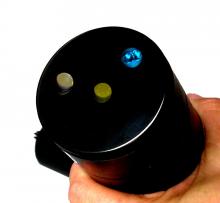
Explore chlorophyll-a concentration data, from the 3-wavelength fluorometer, over time at different locations to investigate regional differences and similarities in primary productivity.
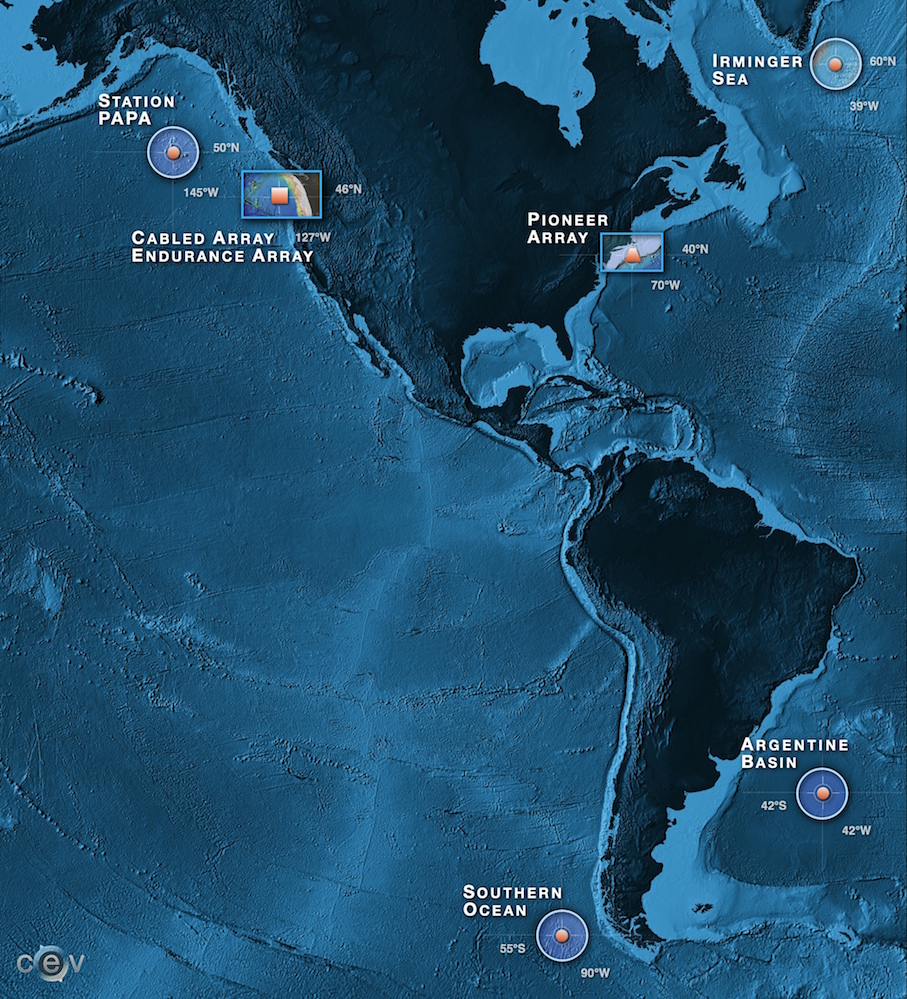
Coastal Endurance and Coastal Pioneer are two of the seven OOI arrays throughout the Pacific and Atlantic Oceans.
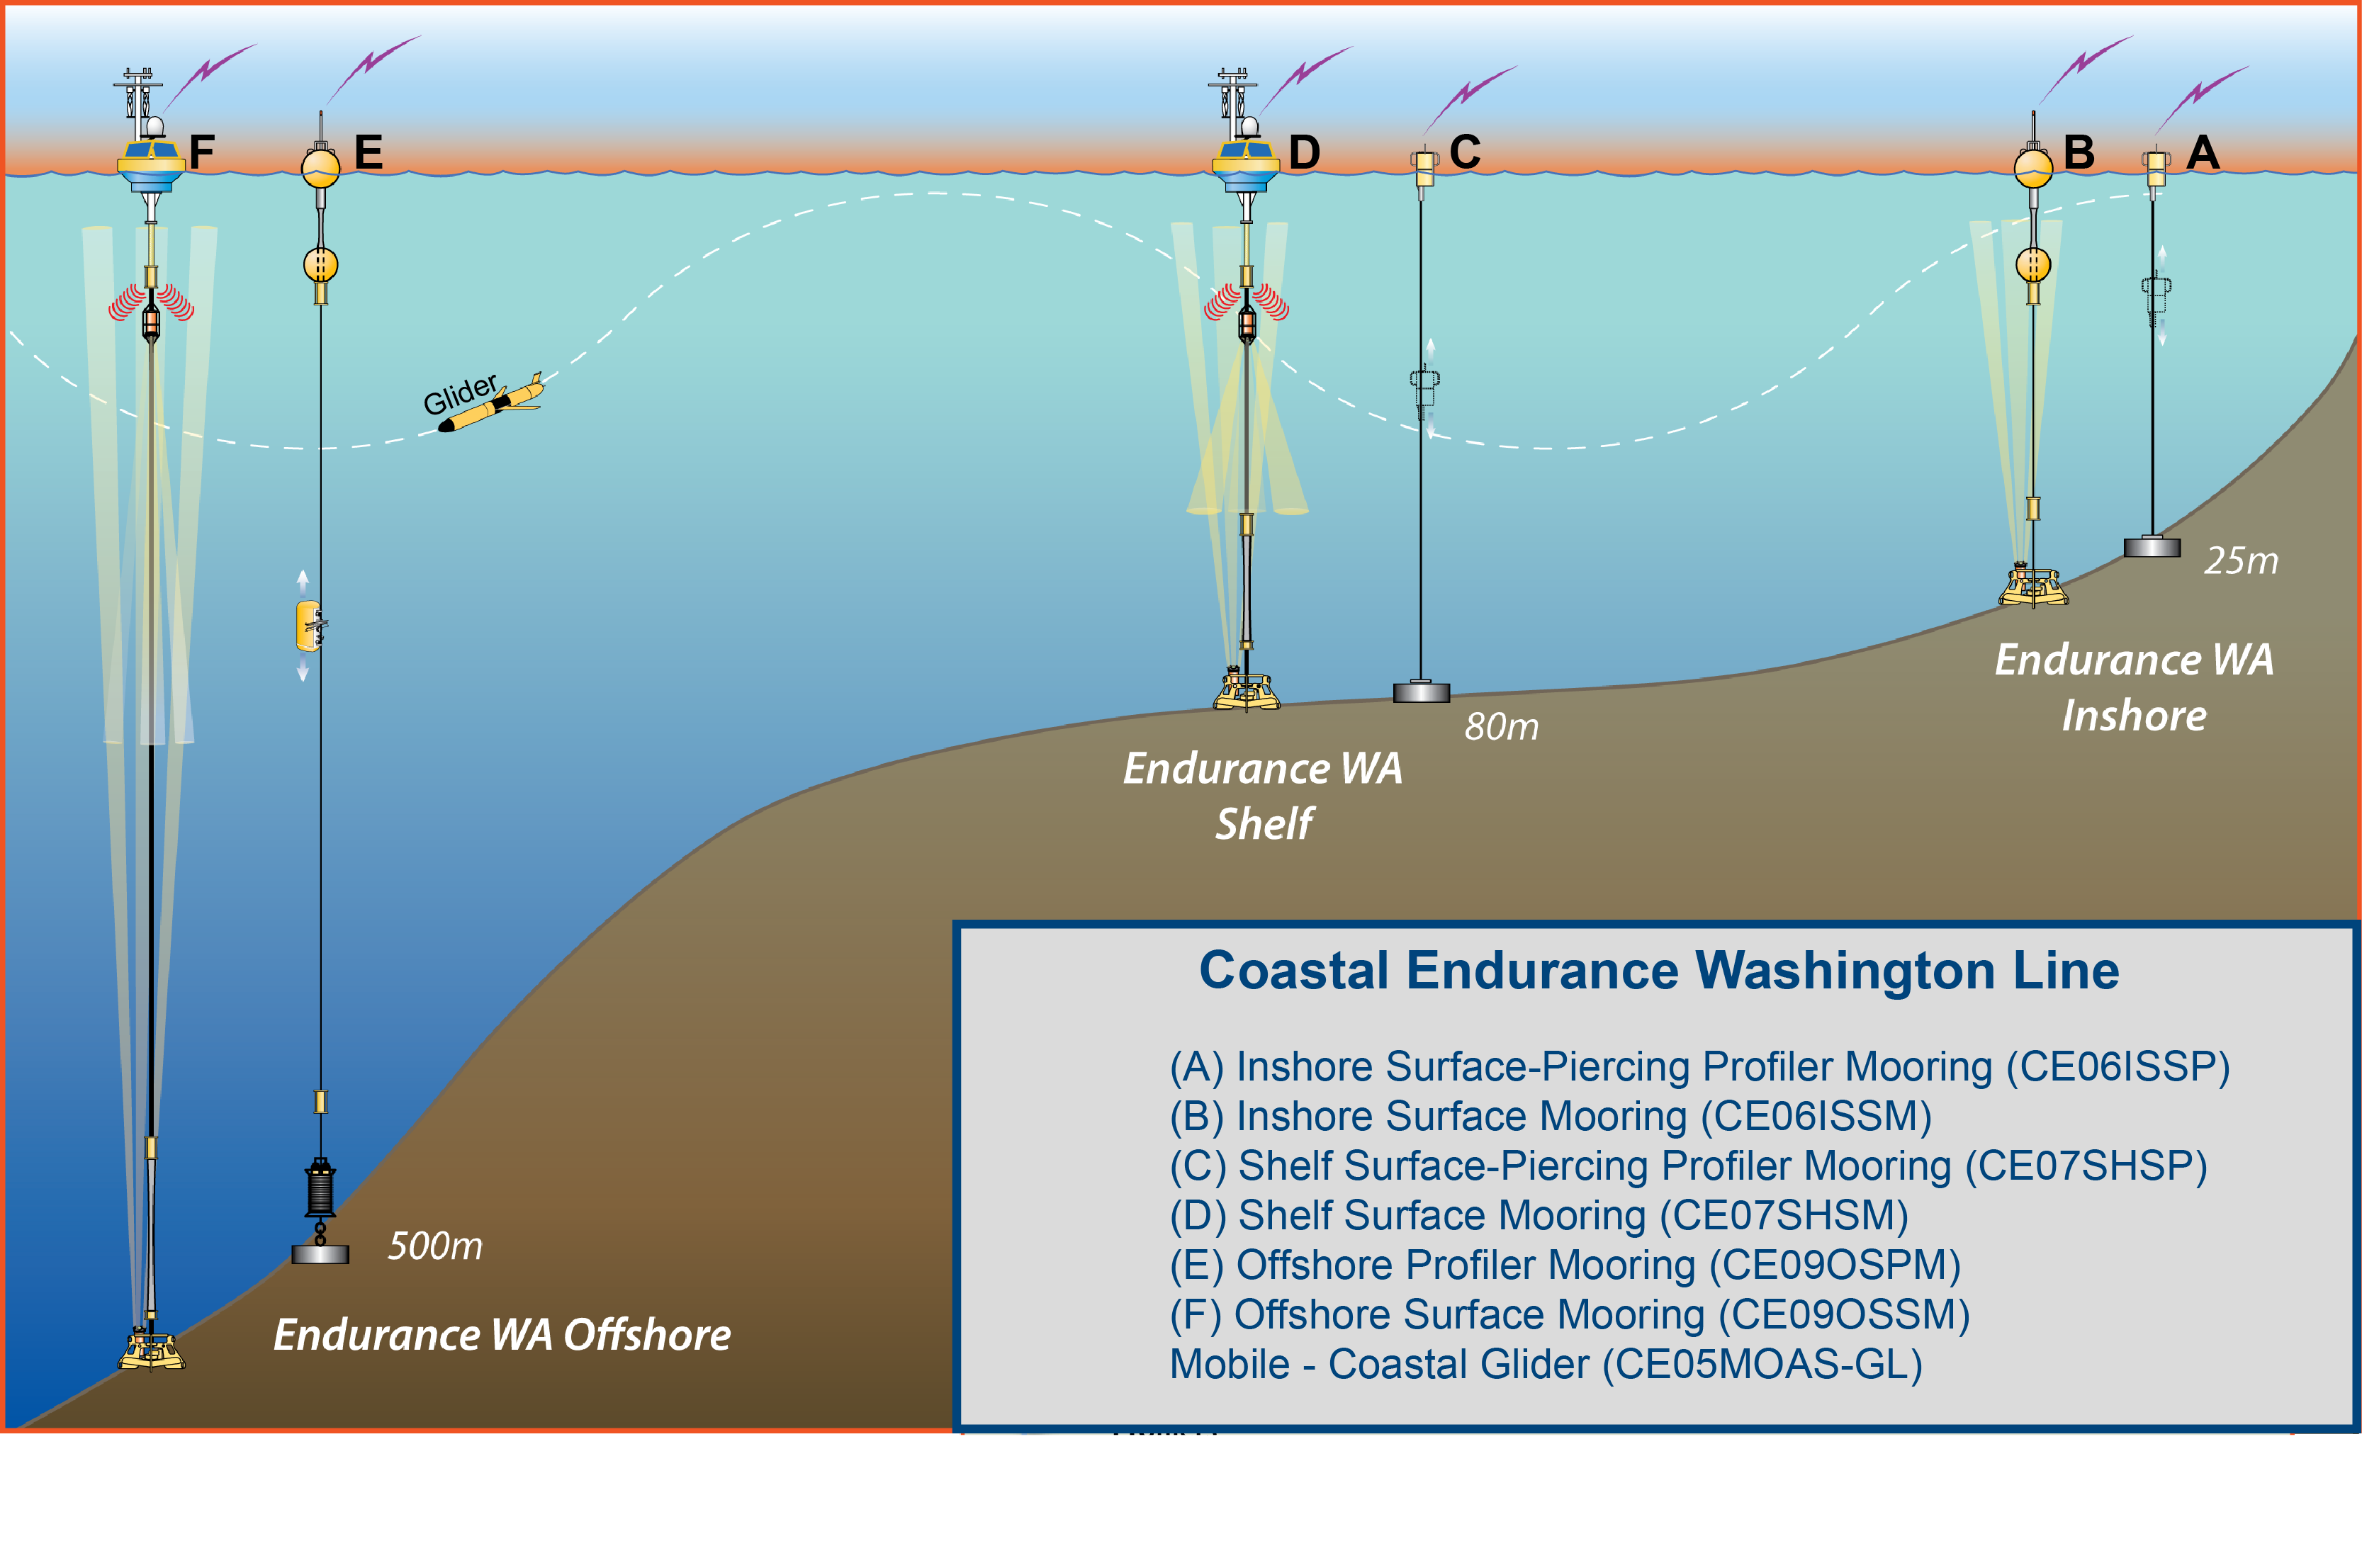
Schematic of the instruments and moorings at the Coastal Endurance Washington Offshore station in the Pacific Ocean. Data in this activity were collected from the Shelf Surface Mooring (D).
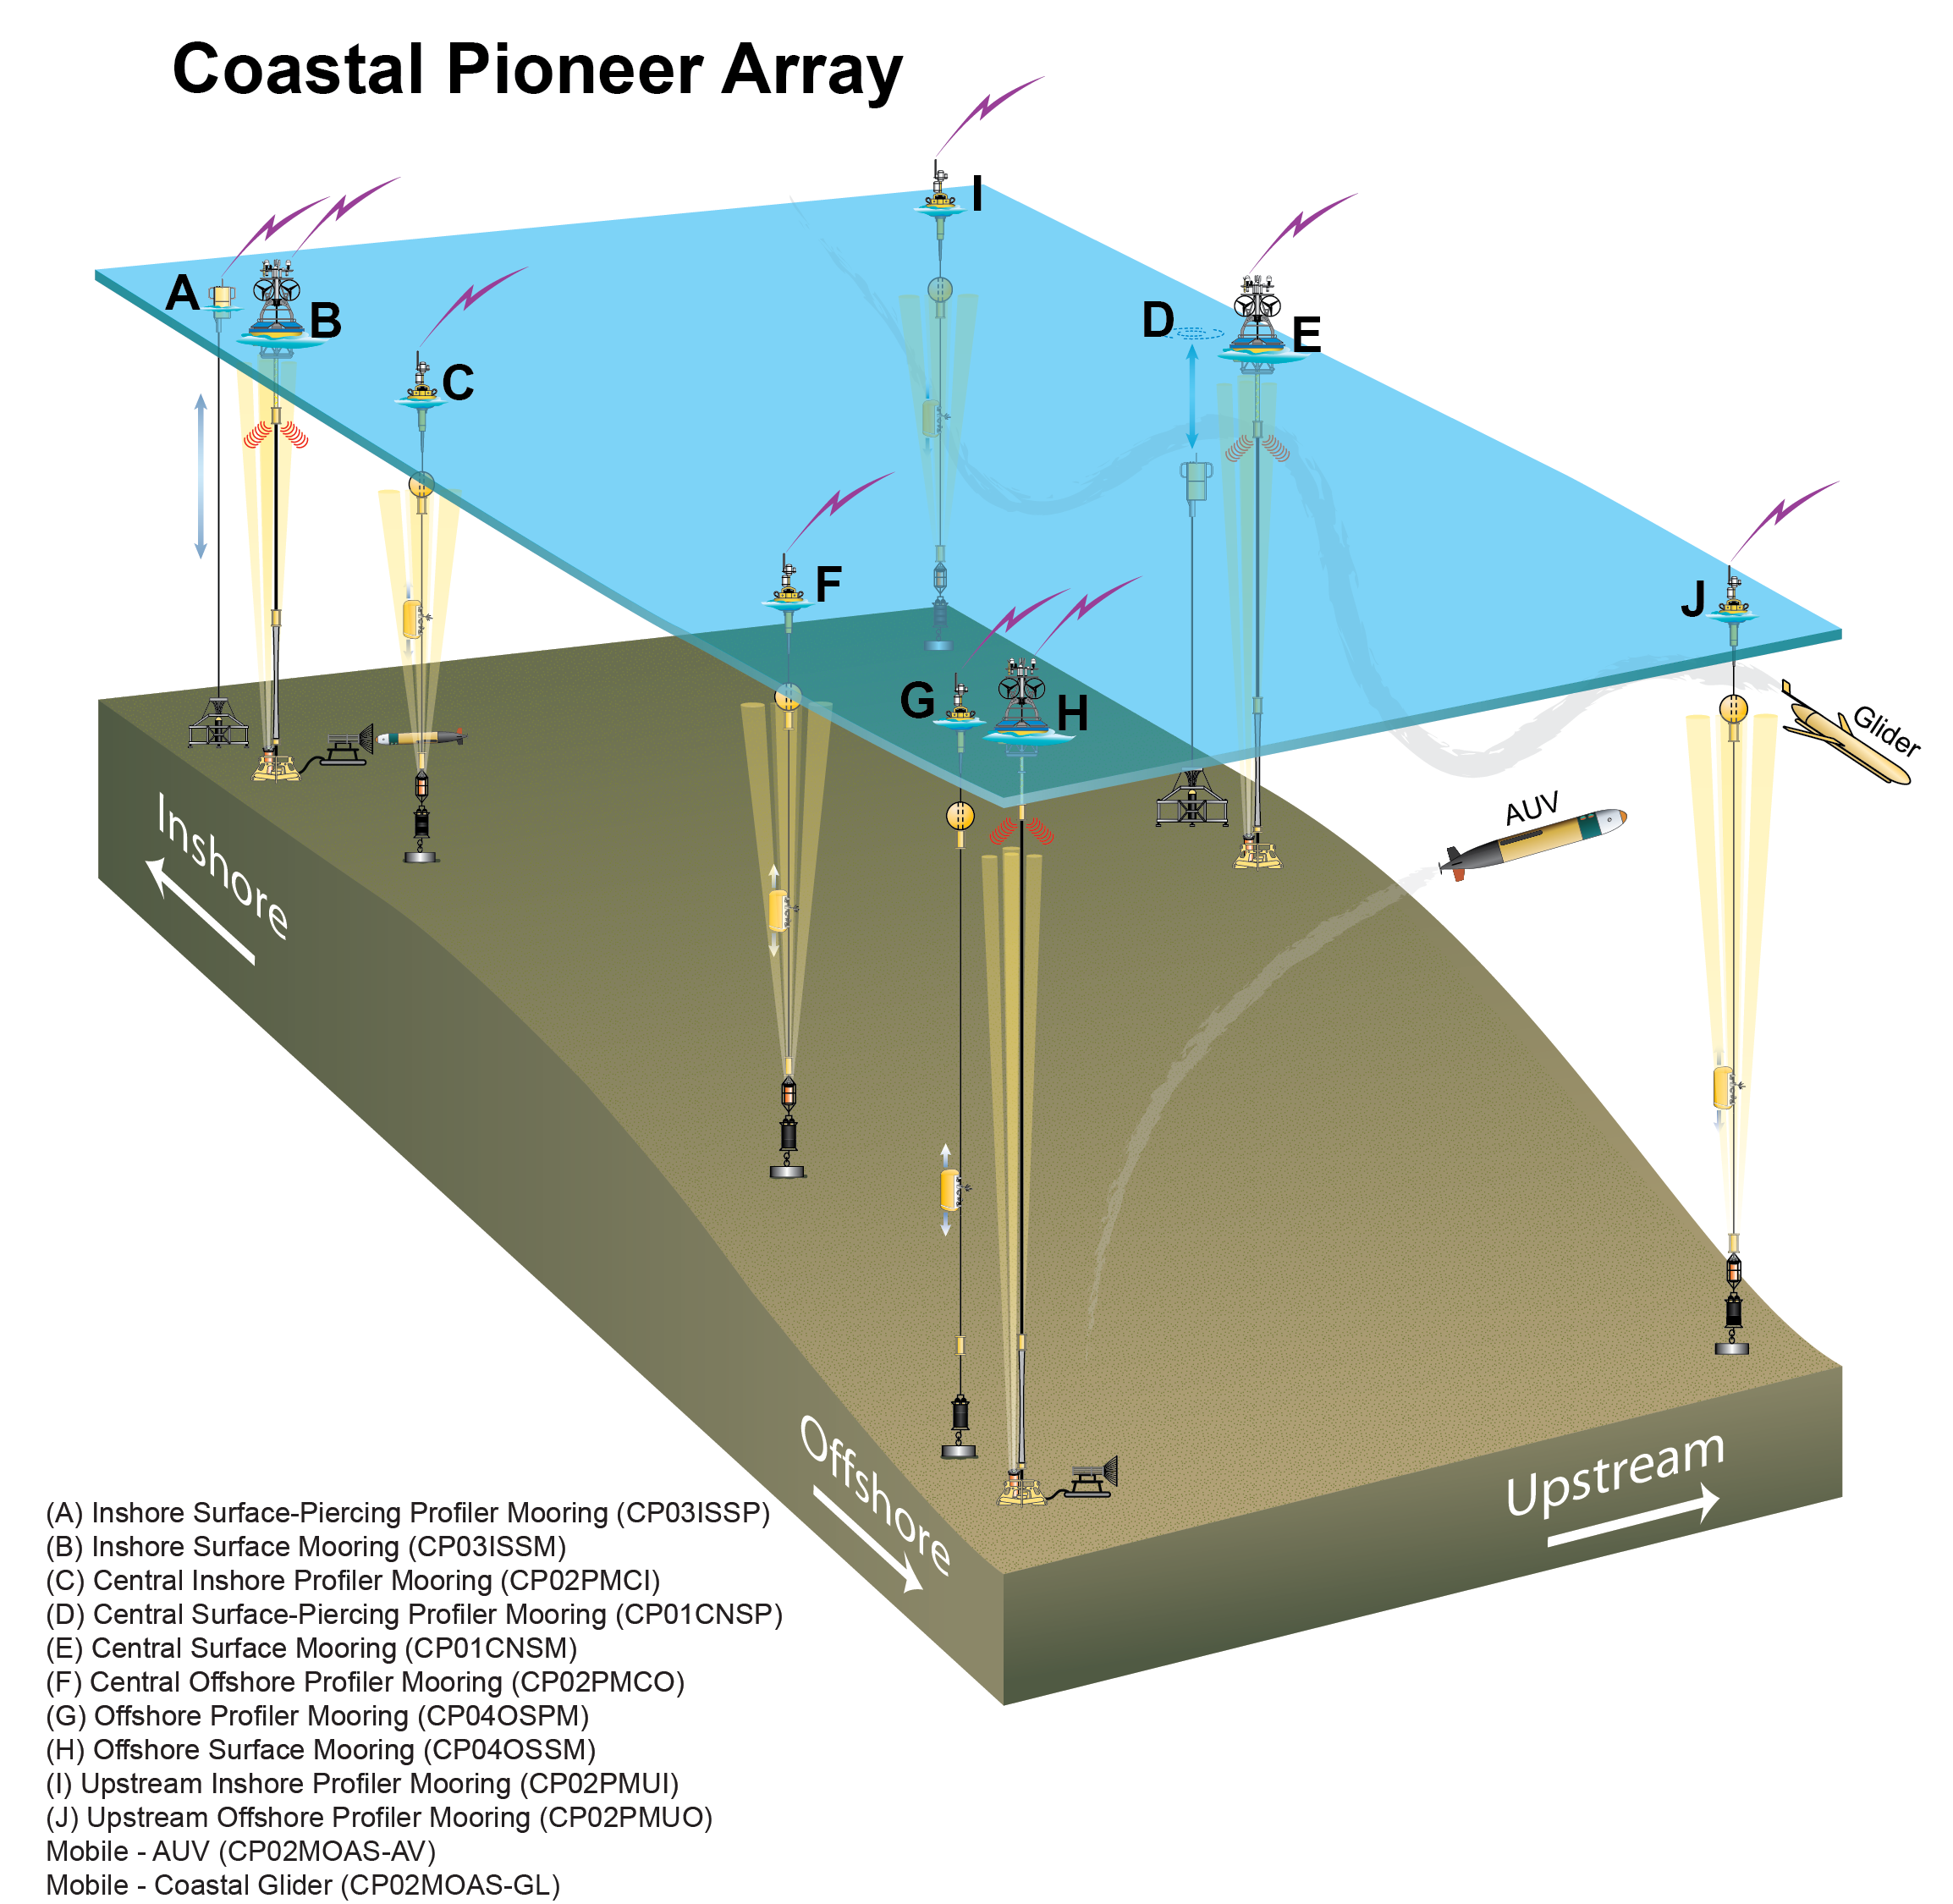
Schematic of the instruments and moorings at the Coastal Pioneer station in the Atlantic Ocean. Data in this activity were collected from the Central Surface Mooring (E).
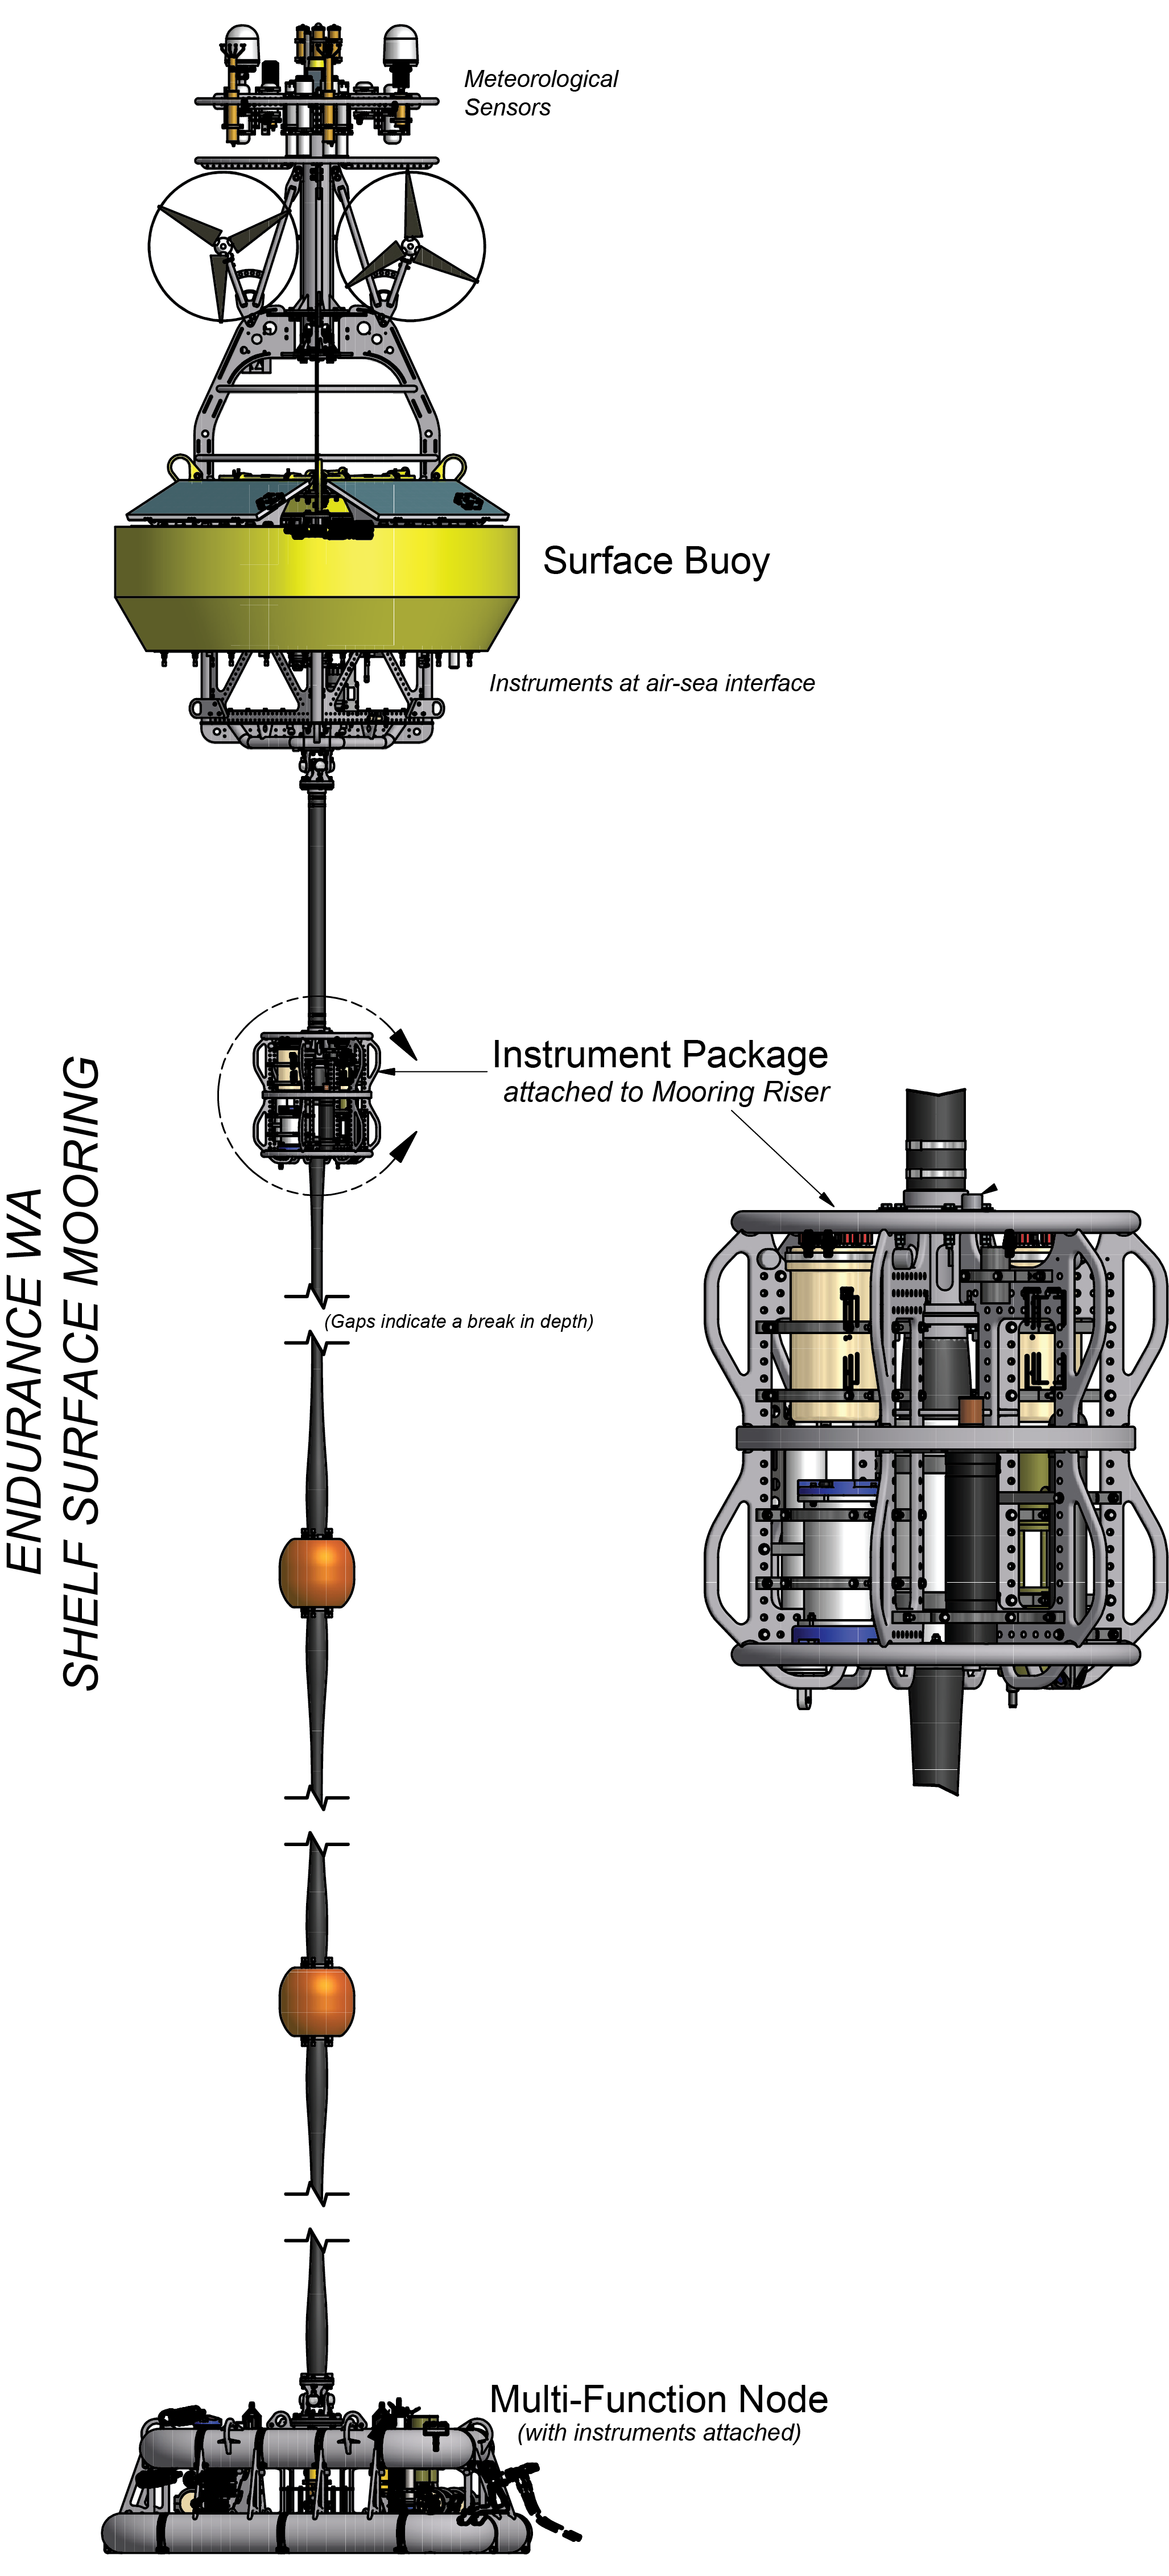
Schematic of the different elements of the Coastal Endurance Washington Offshore Shelf Surface Mooring. The 3-wavelength fluorometer is on the Instrument Package in 7m of water.
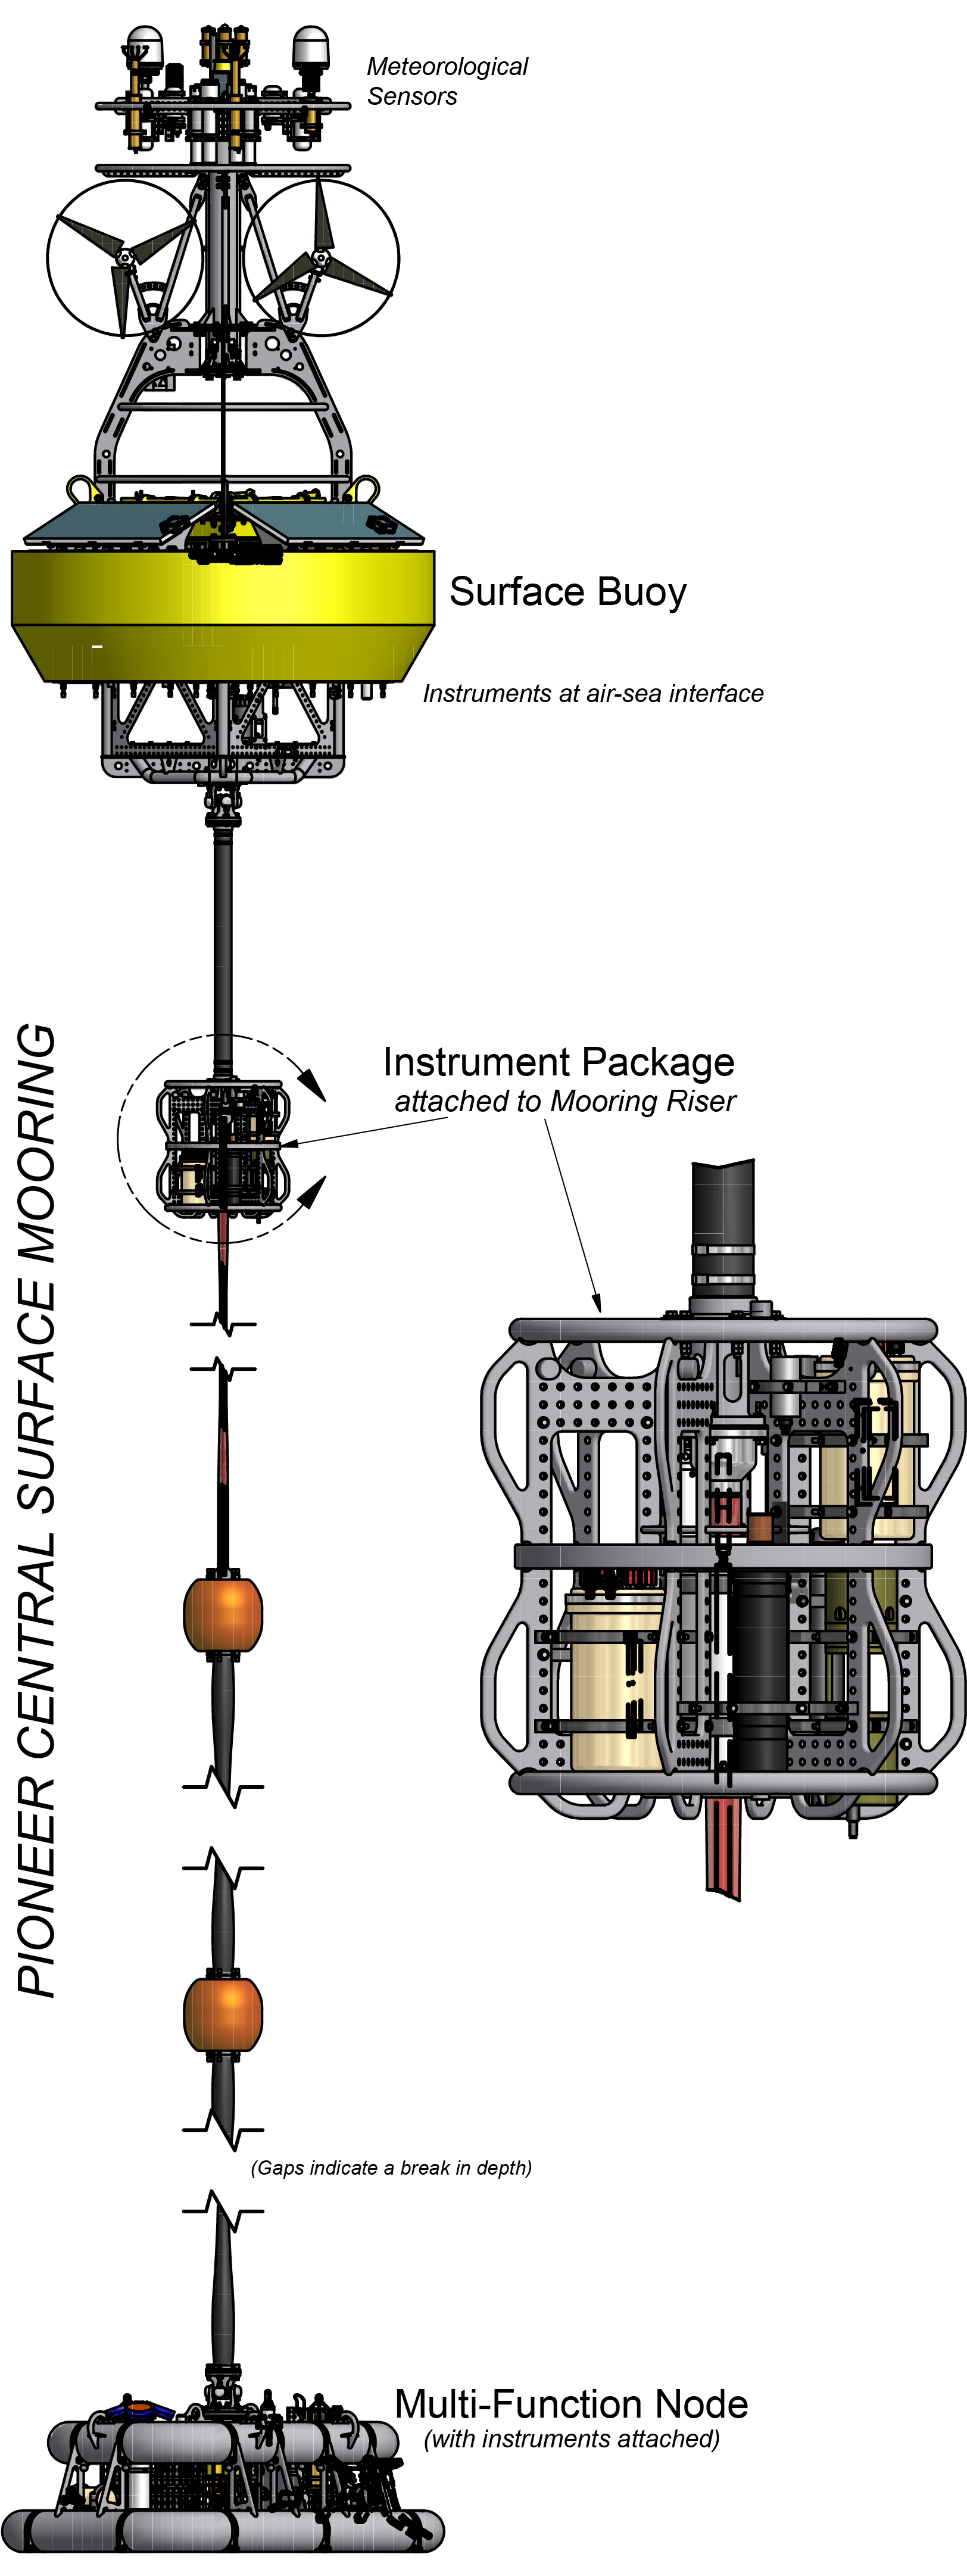
Schematic of the different elements of the Coastal Pioneer Central Surface Mooring. The 3-wavelength flourometer is on the Instrument Package in 7m of water.
Schematic of the instruments and moorings at the Global Southern Ocean station in the Pacific Ocean. Data in this activity were collected from the Subsurface Flanking Mooring A (C).
Schematic of the instruments and moorings at the Global Argentine Basin station in the Atlantic Ocean. Data in this activity were collected from the Subsurface Flanking Mooring A (C).
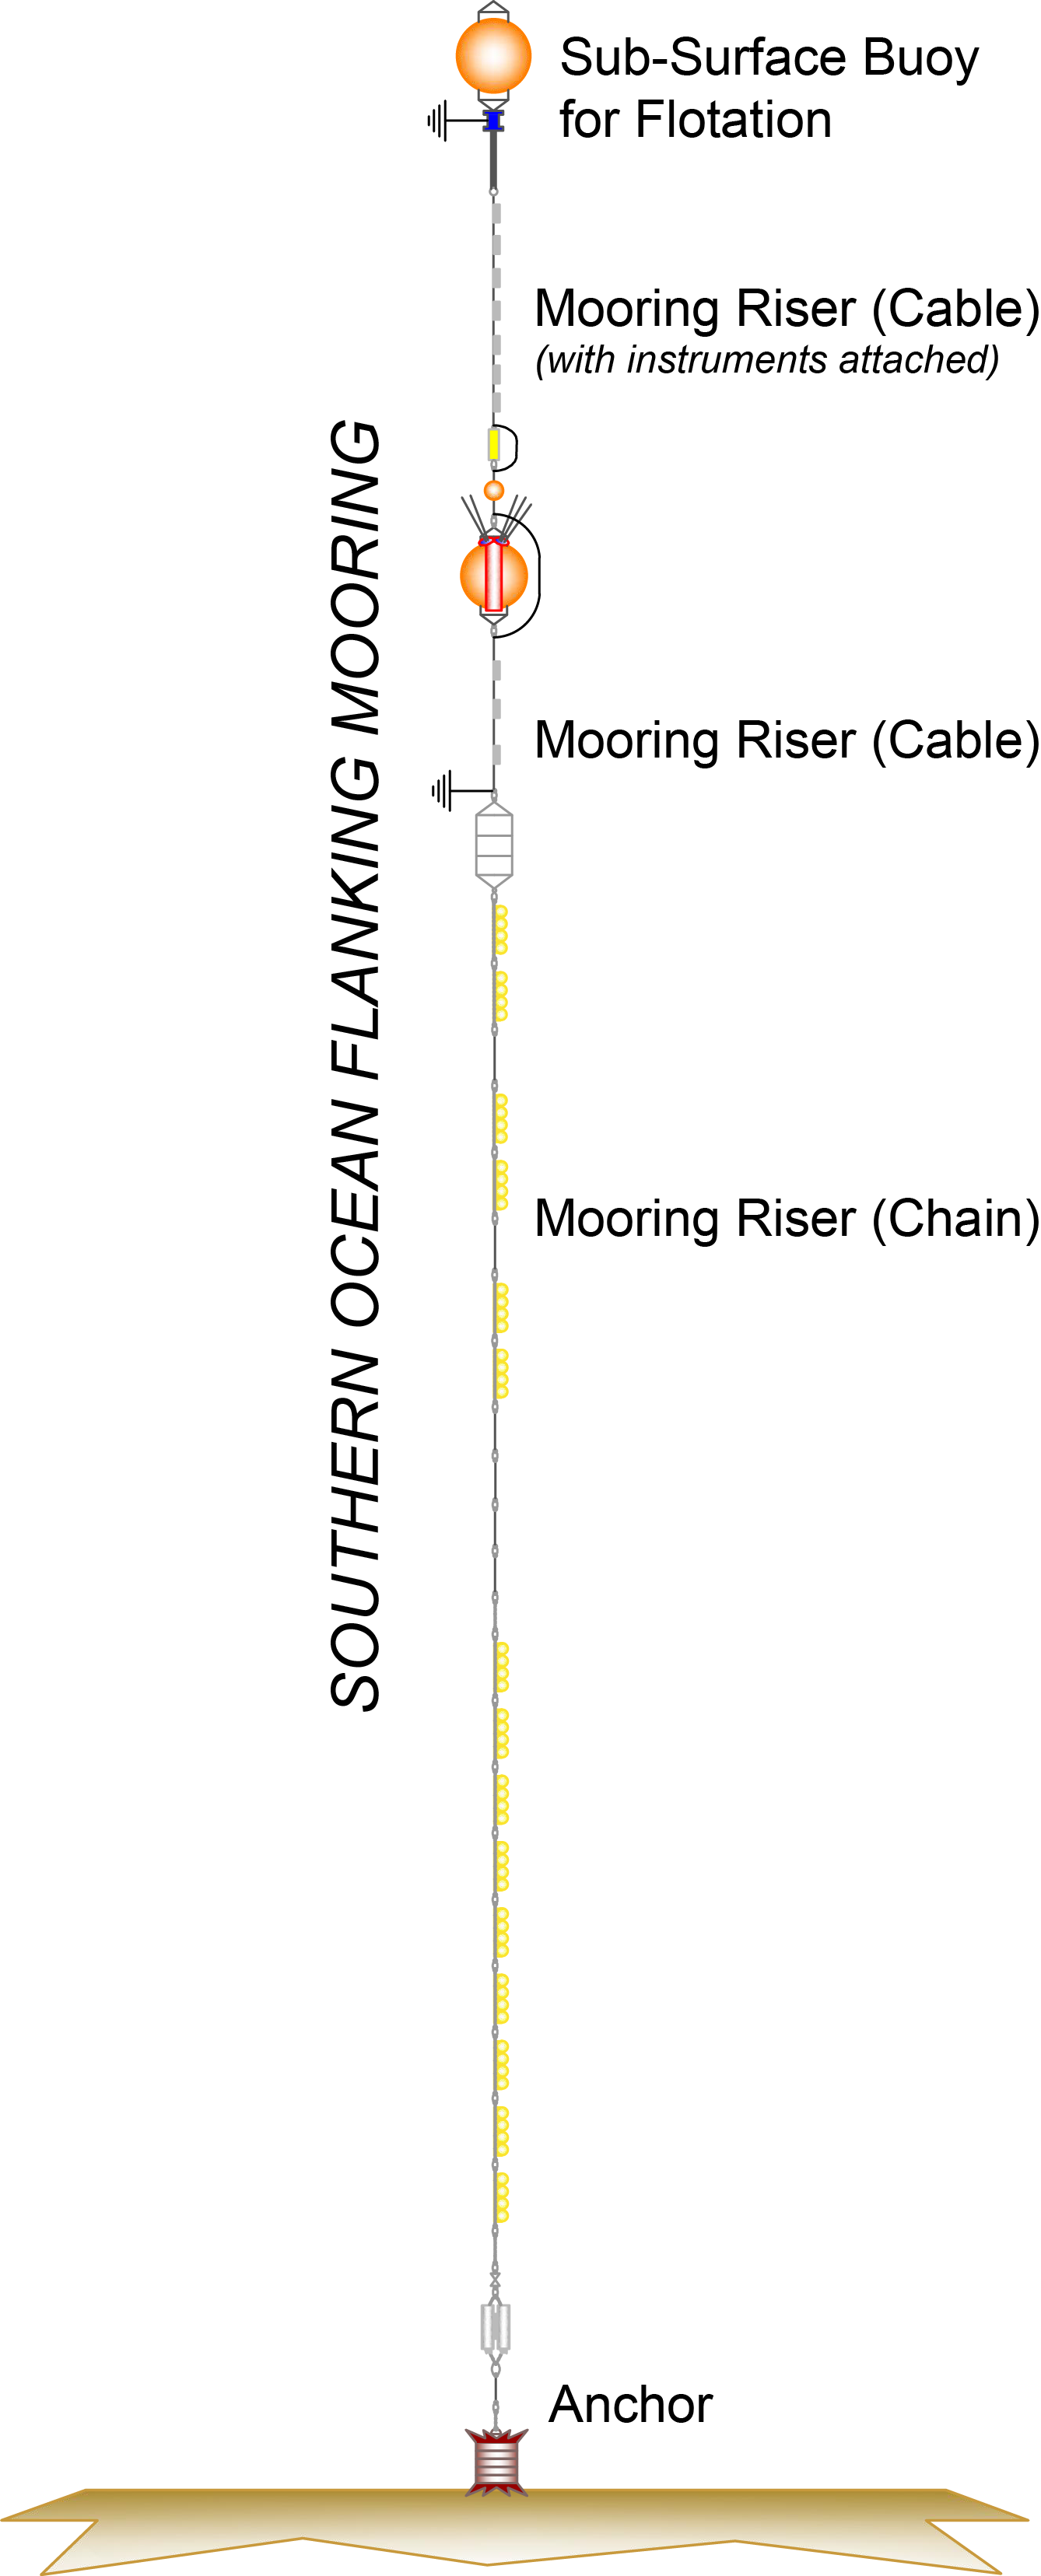
Schematic of the different elements of the Global Southern Ocean Subsurface Flanking Mooring. The 3-wavelength fluorometer is on the Sub-Surface Buoy in 30m of water.
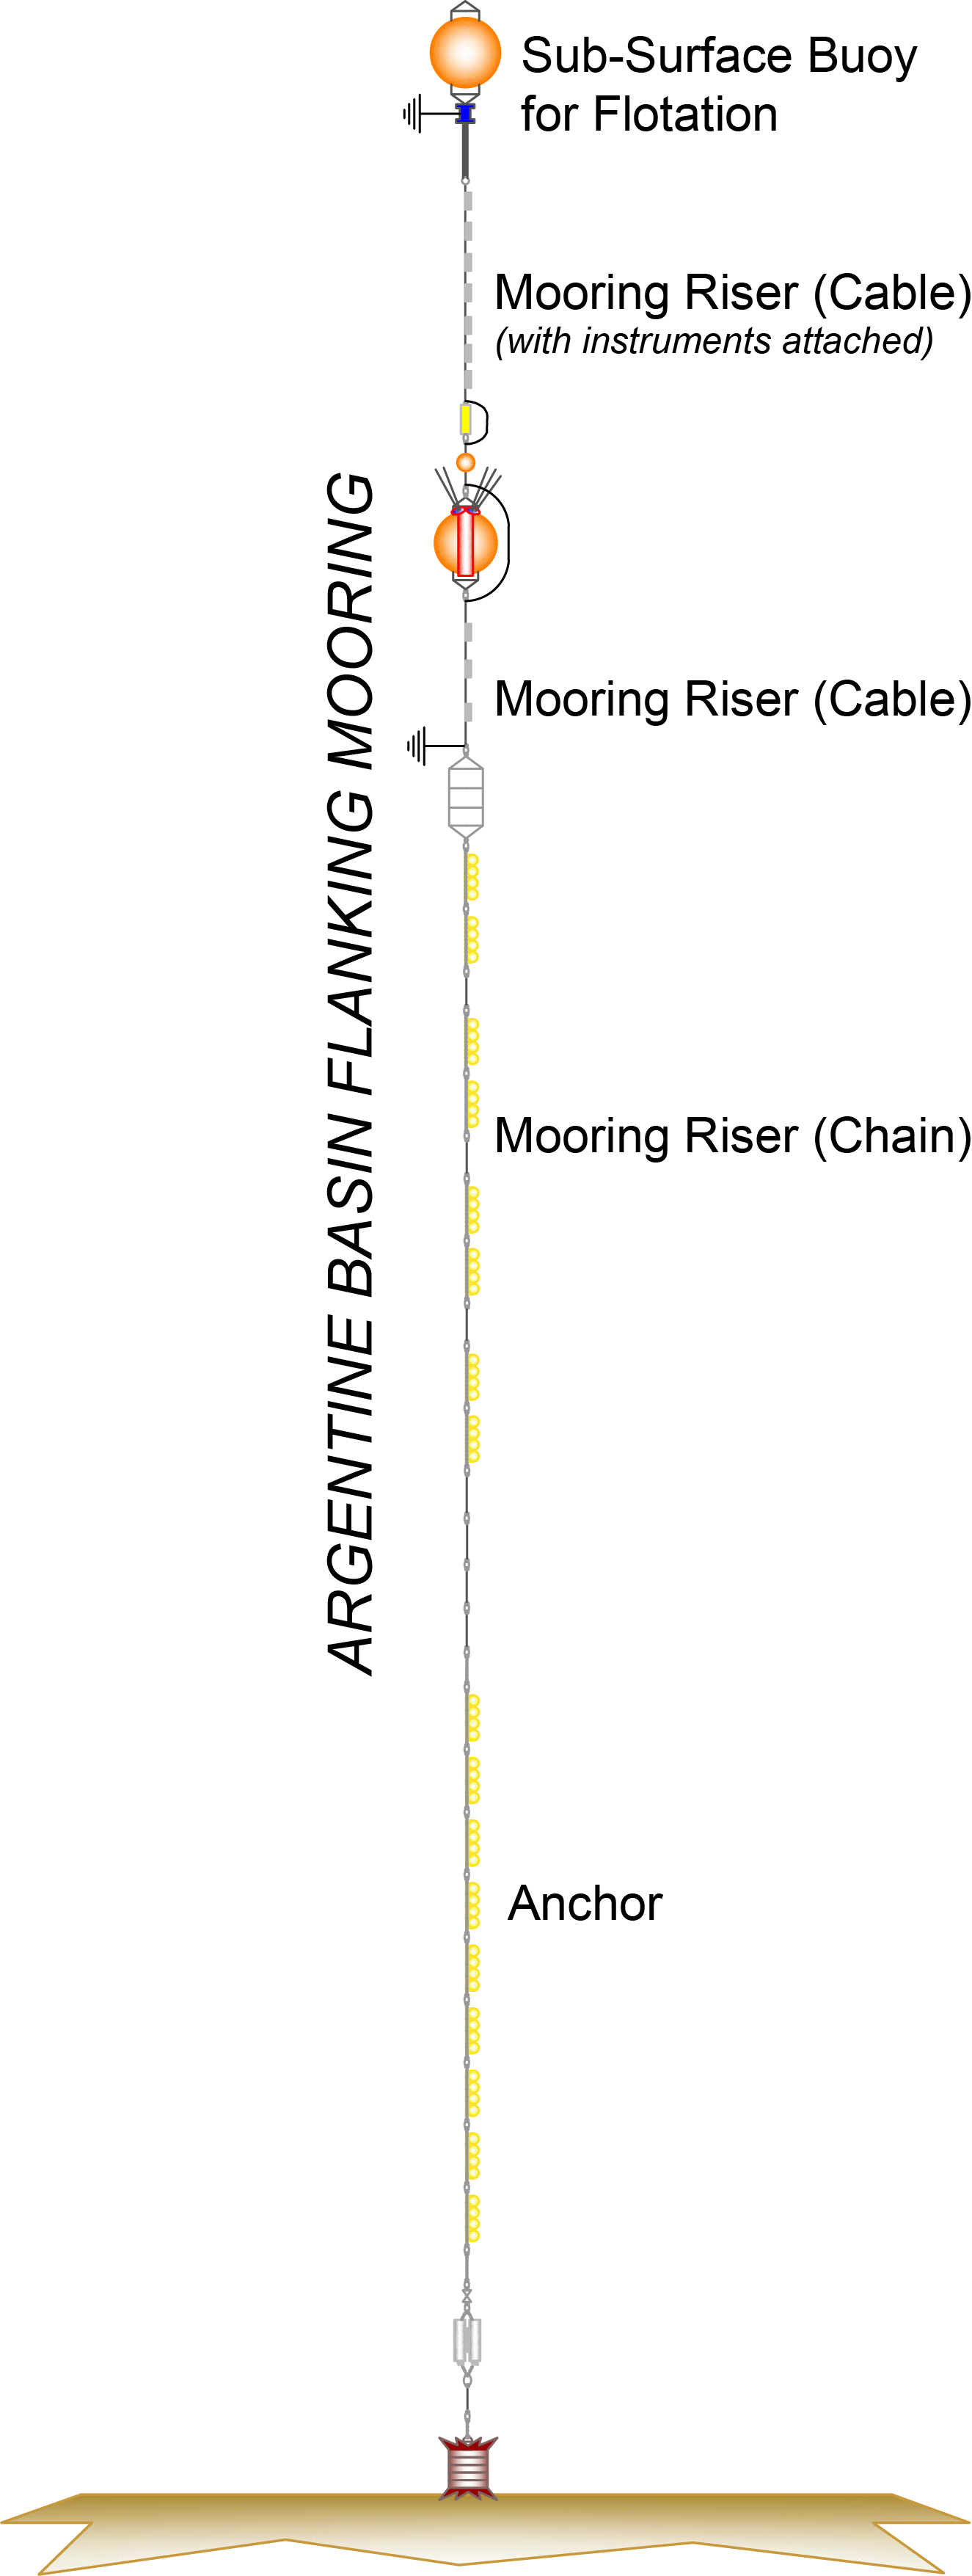
Schematic of the different elements of the Global Argentine Basin Subsurface Flanking Mooring. The 3-wavelength fluorometer is on the Sub-Surface Buoy in 30m of water.
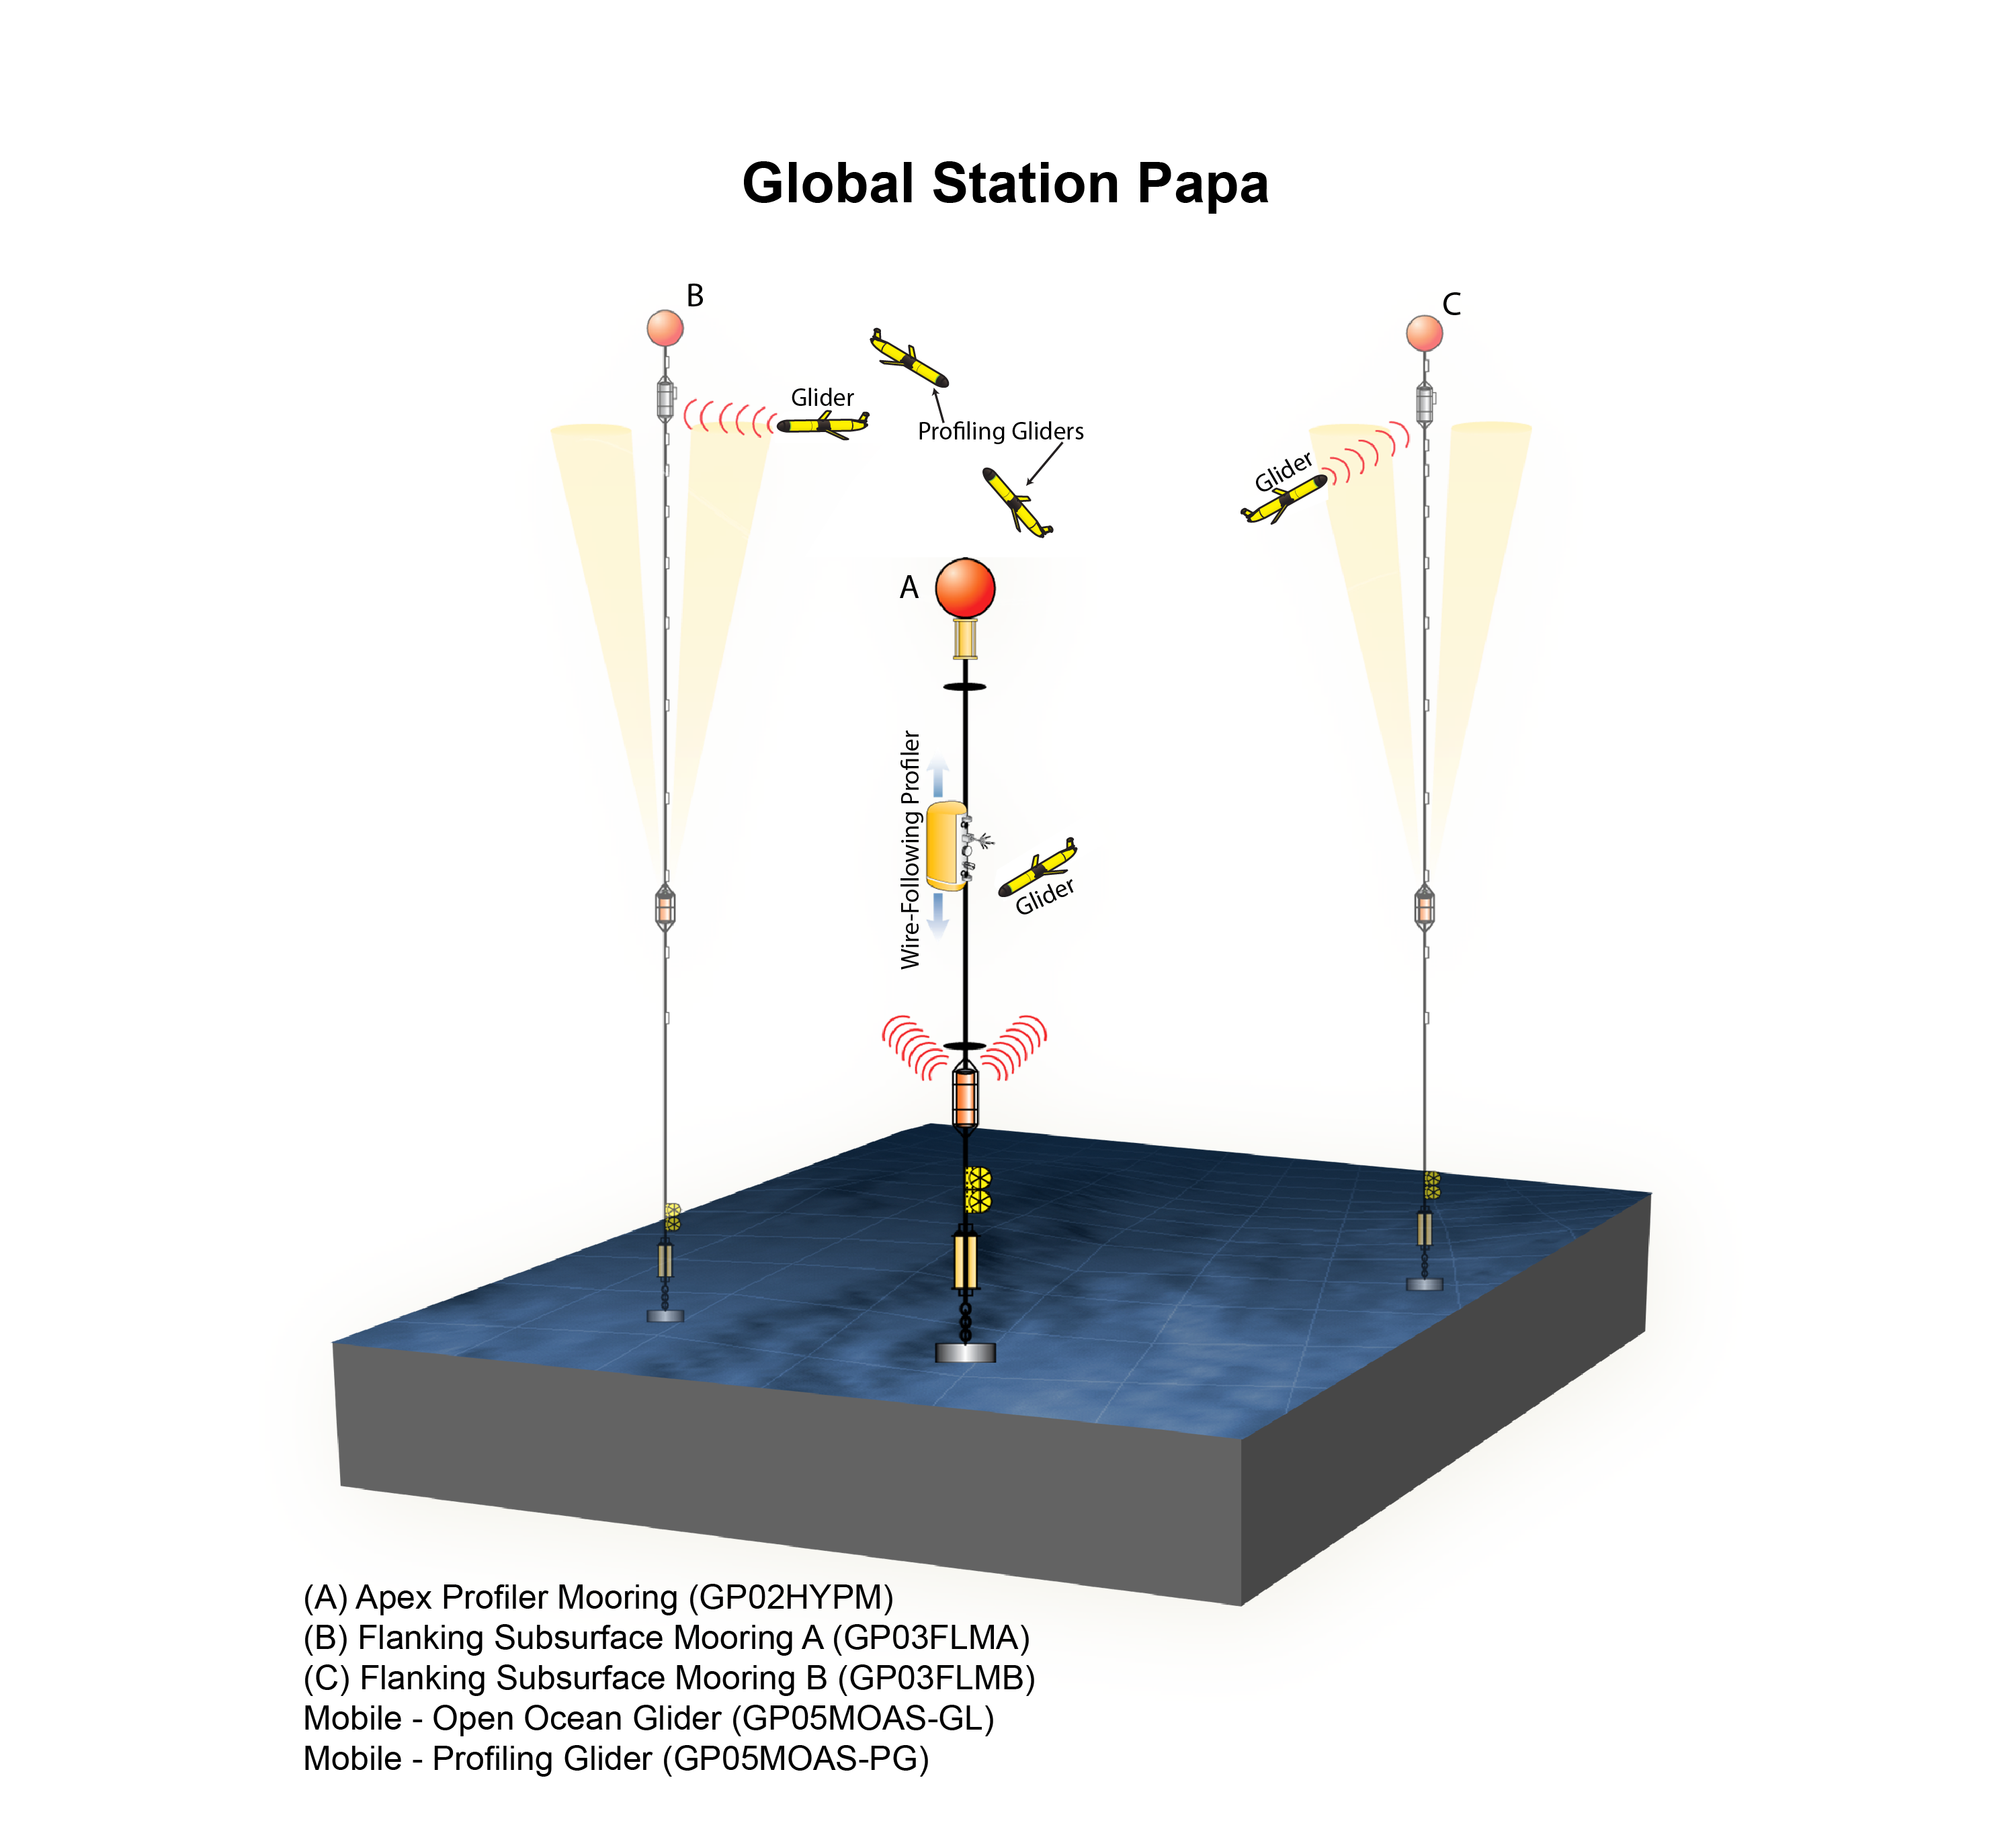
Schematic of the instruments and moorings at the Global Station Papa station in the Pacific Ocean. Data in this activity were collected from the Subsurface Flanking Mooring A (C).
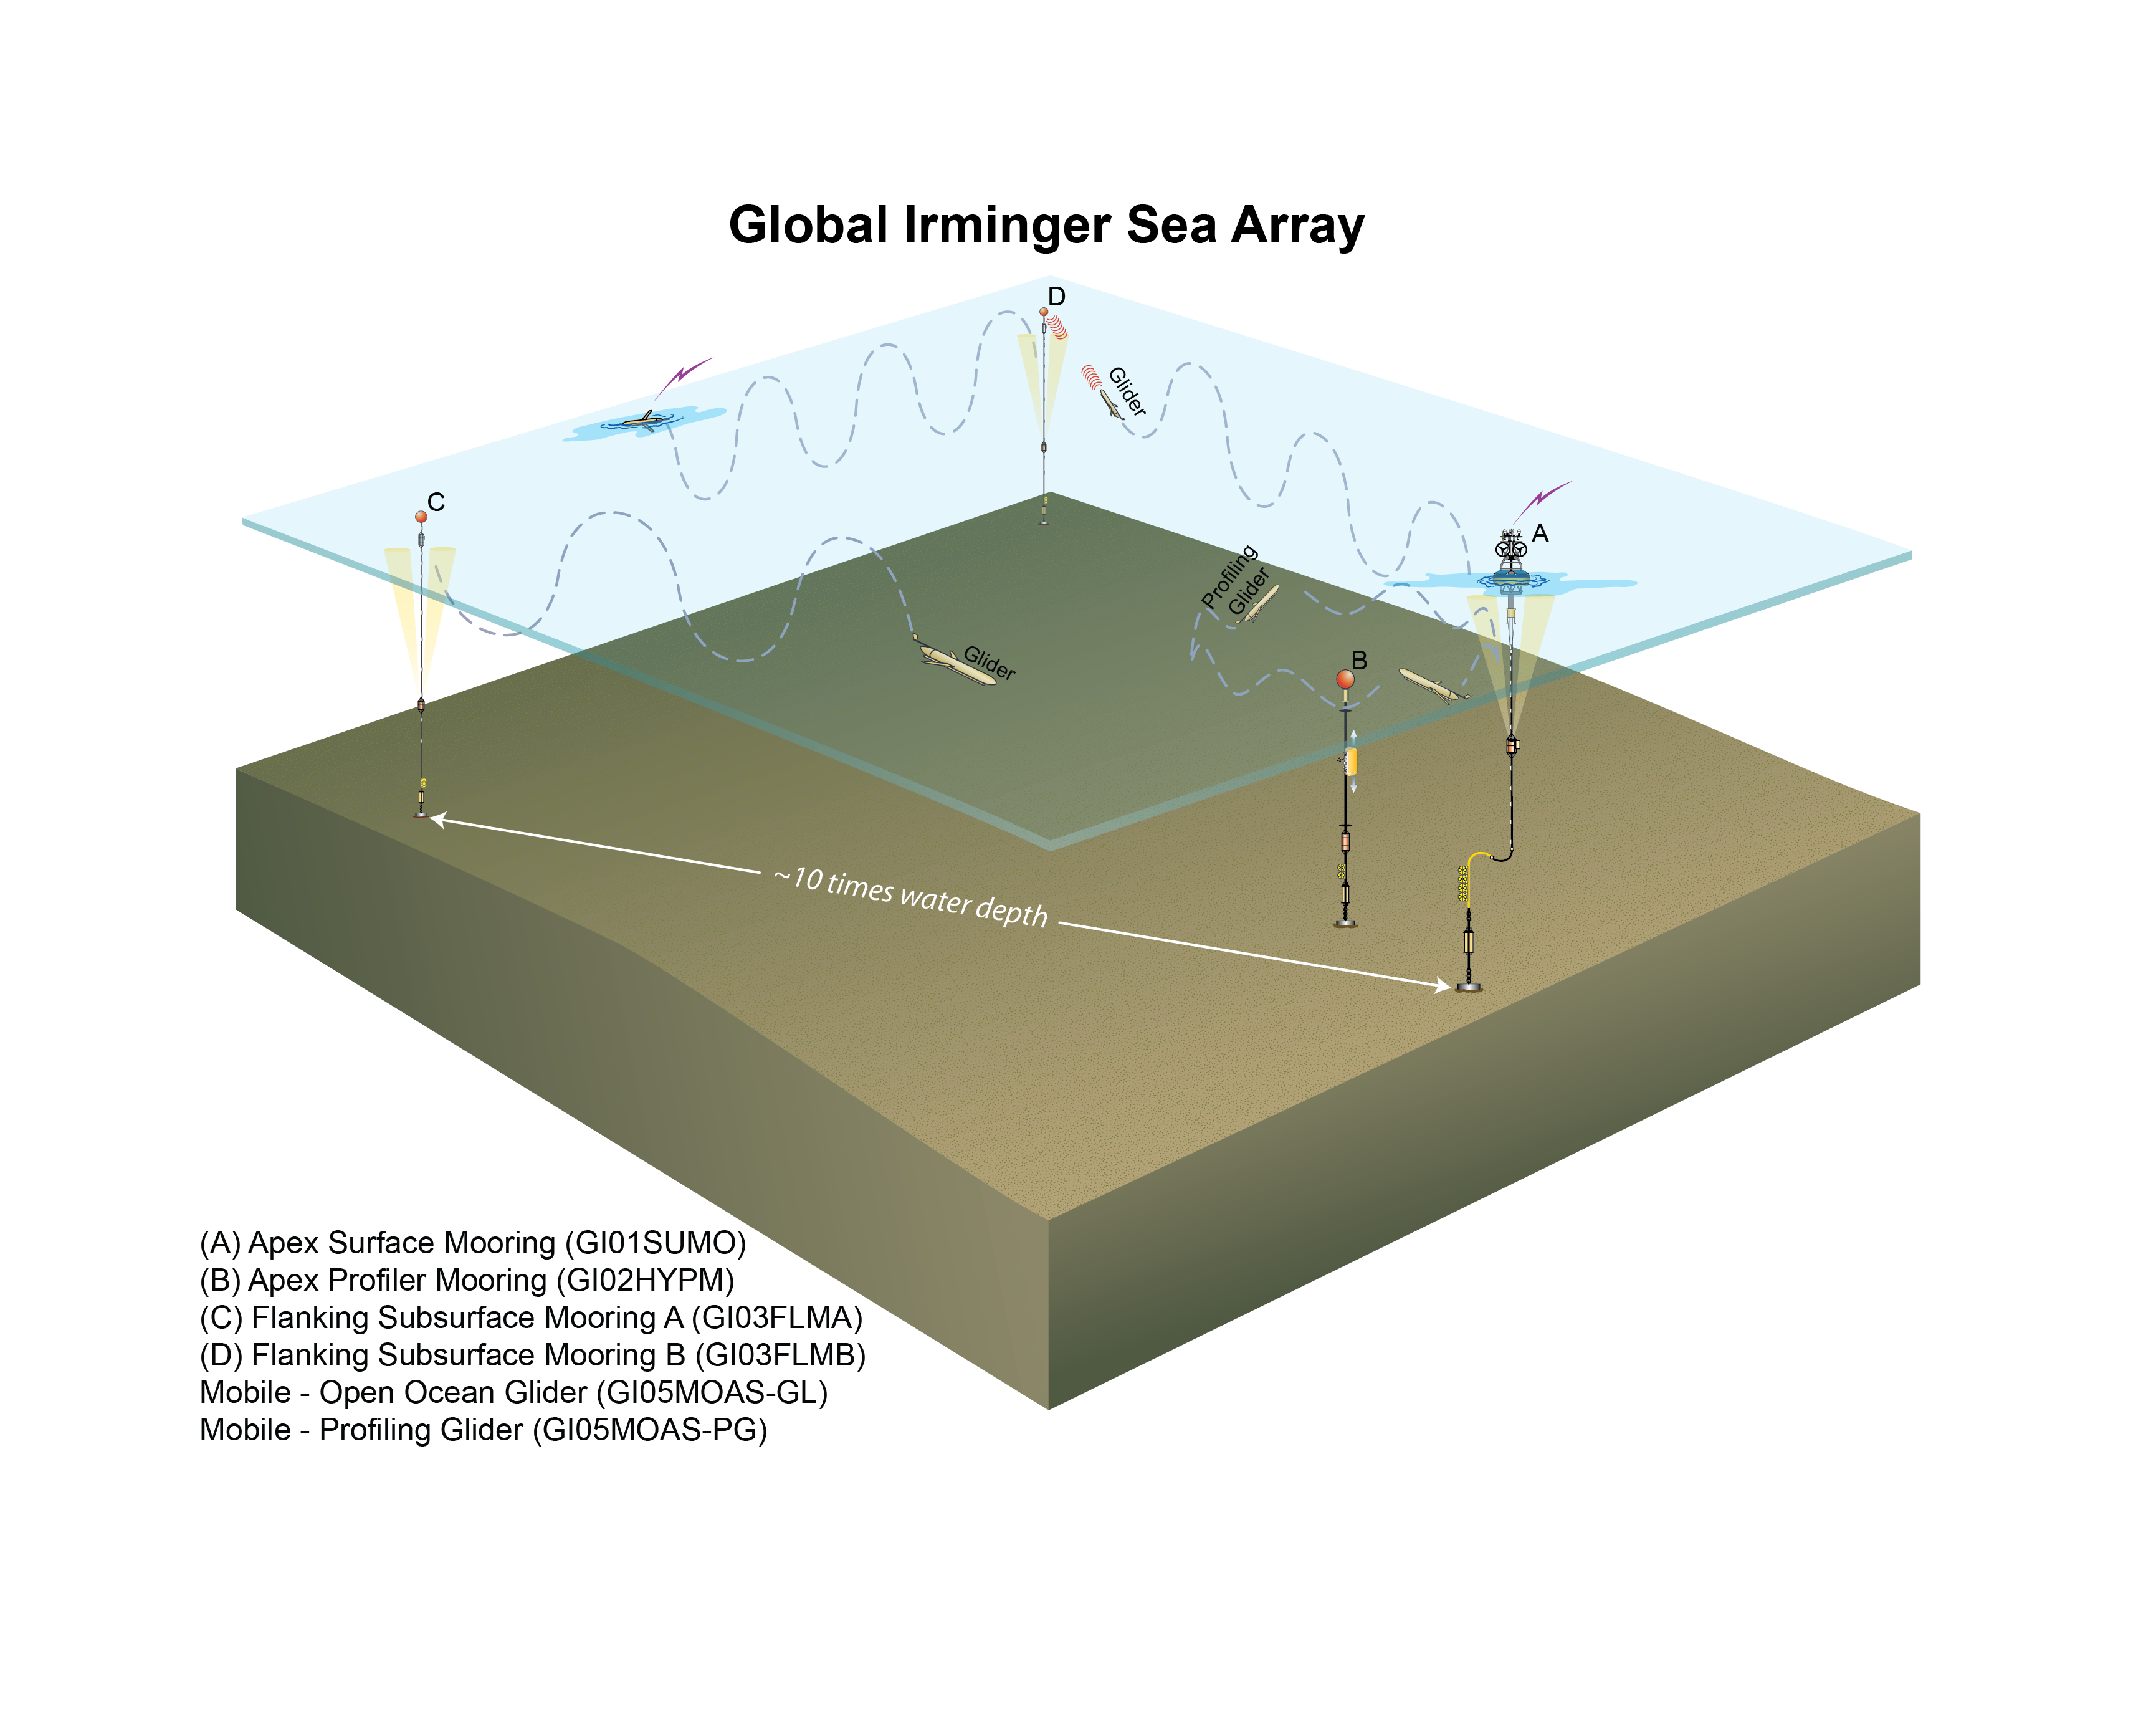
Schematic of the instruments and moorings at the Global Irminger Sea station in the Atlantic Ocean. Data in this activity were collected from the Subsurface Flanking Mooring A (C).
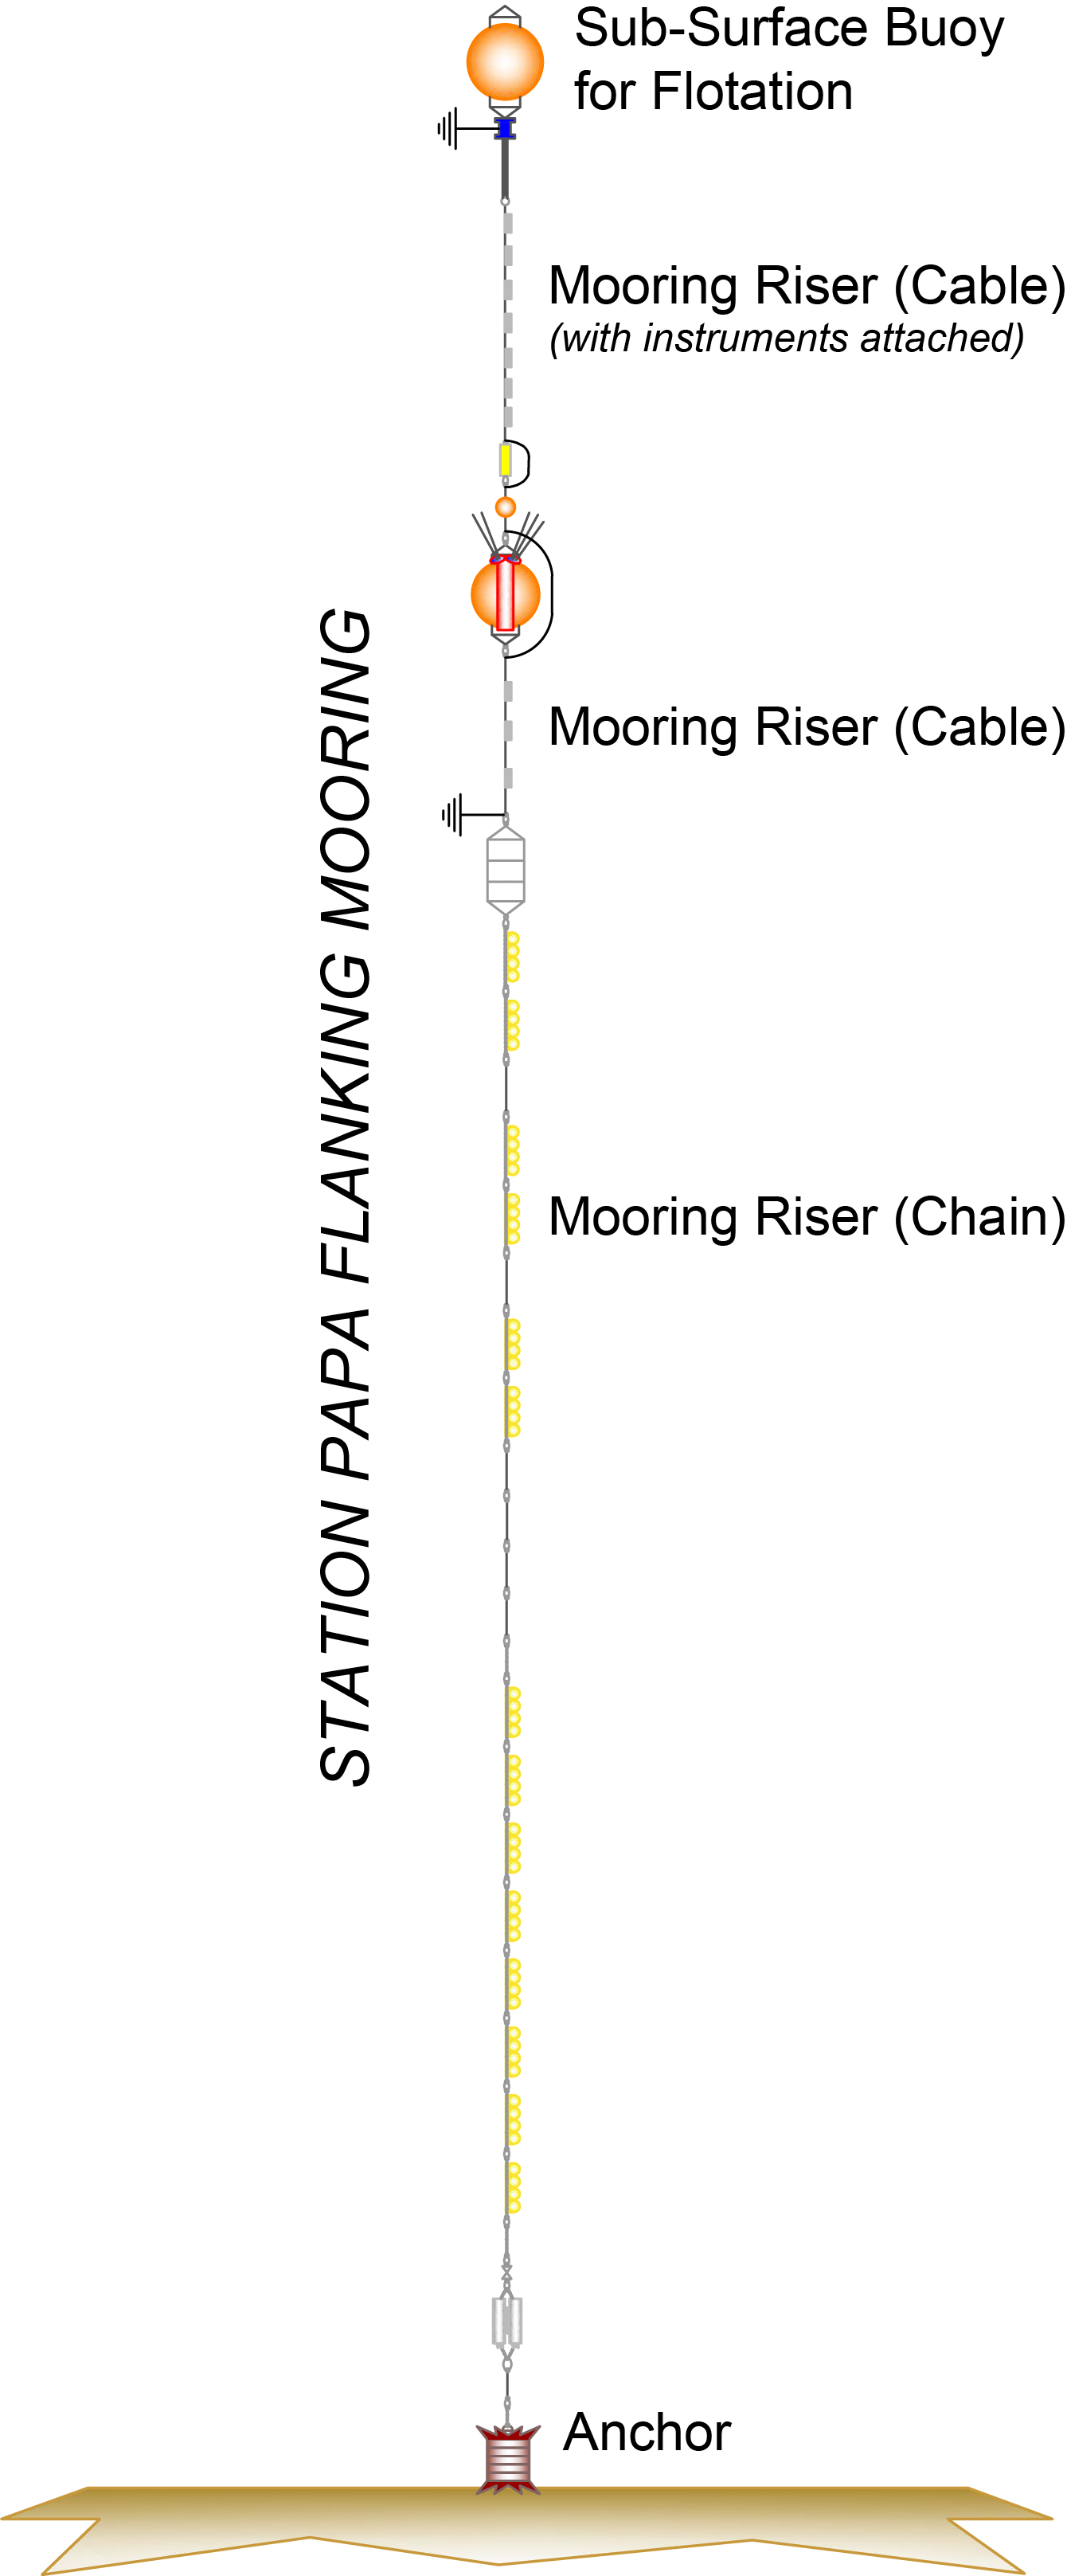
Schematic of the different elements of the Global Station Papa Subsurface Flanking Mooring. The 3-wavelength fluorometer is on the Sub-Surface Buoy in 30m of water.
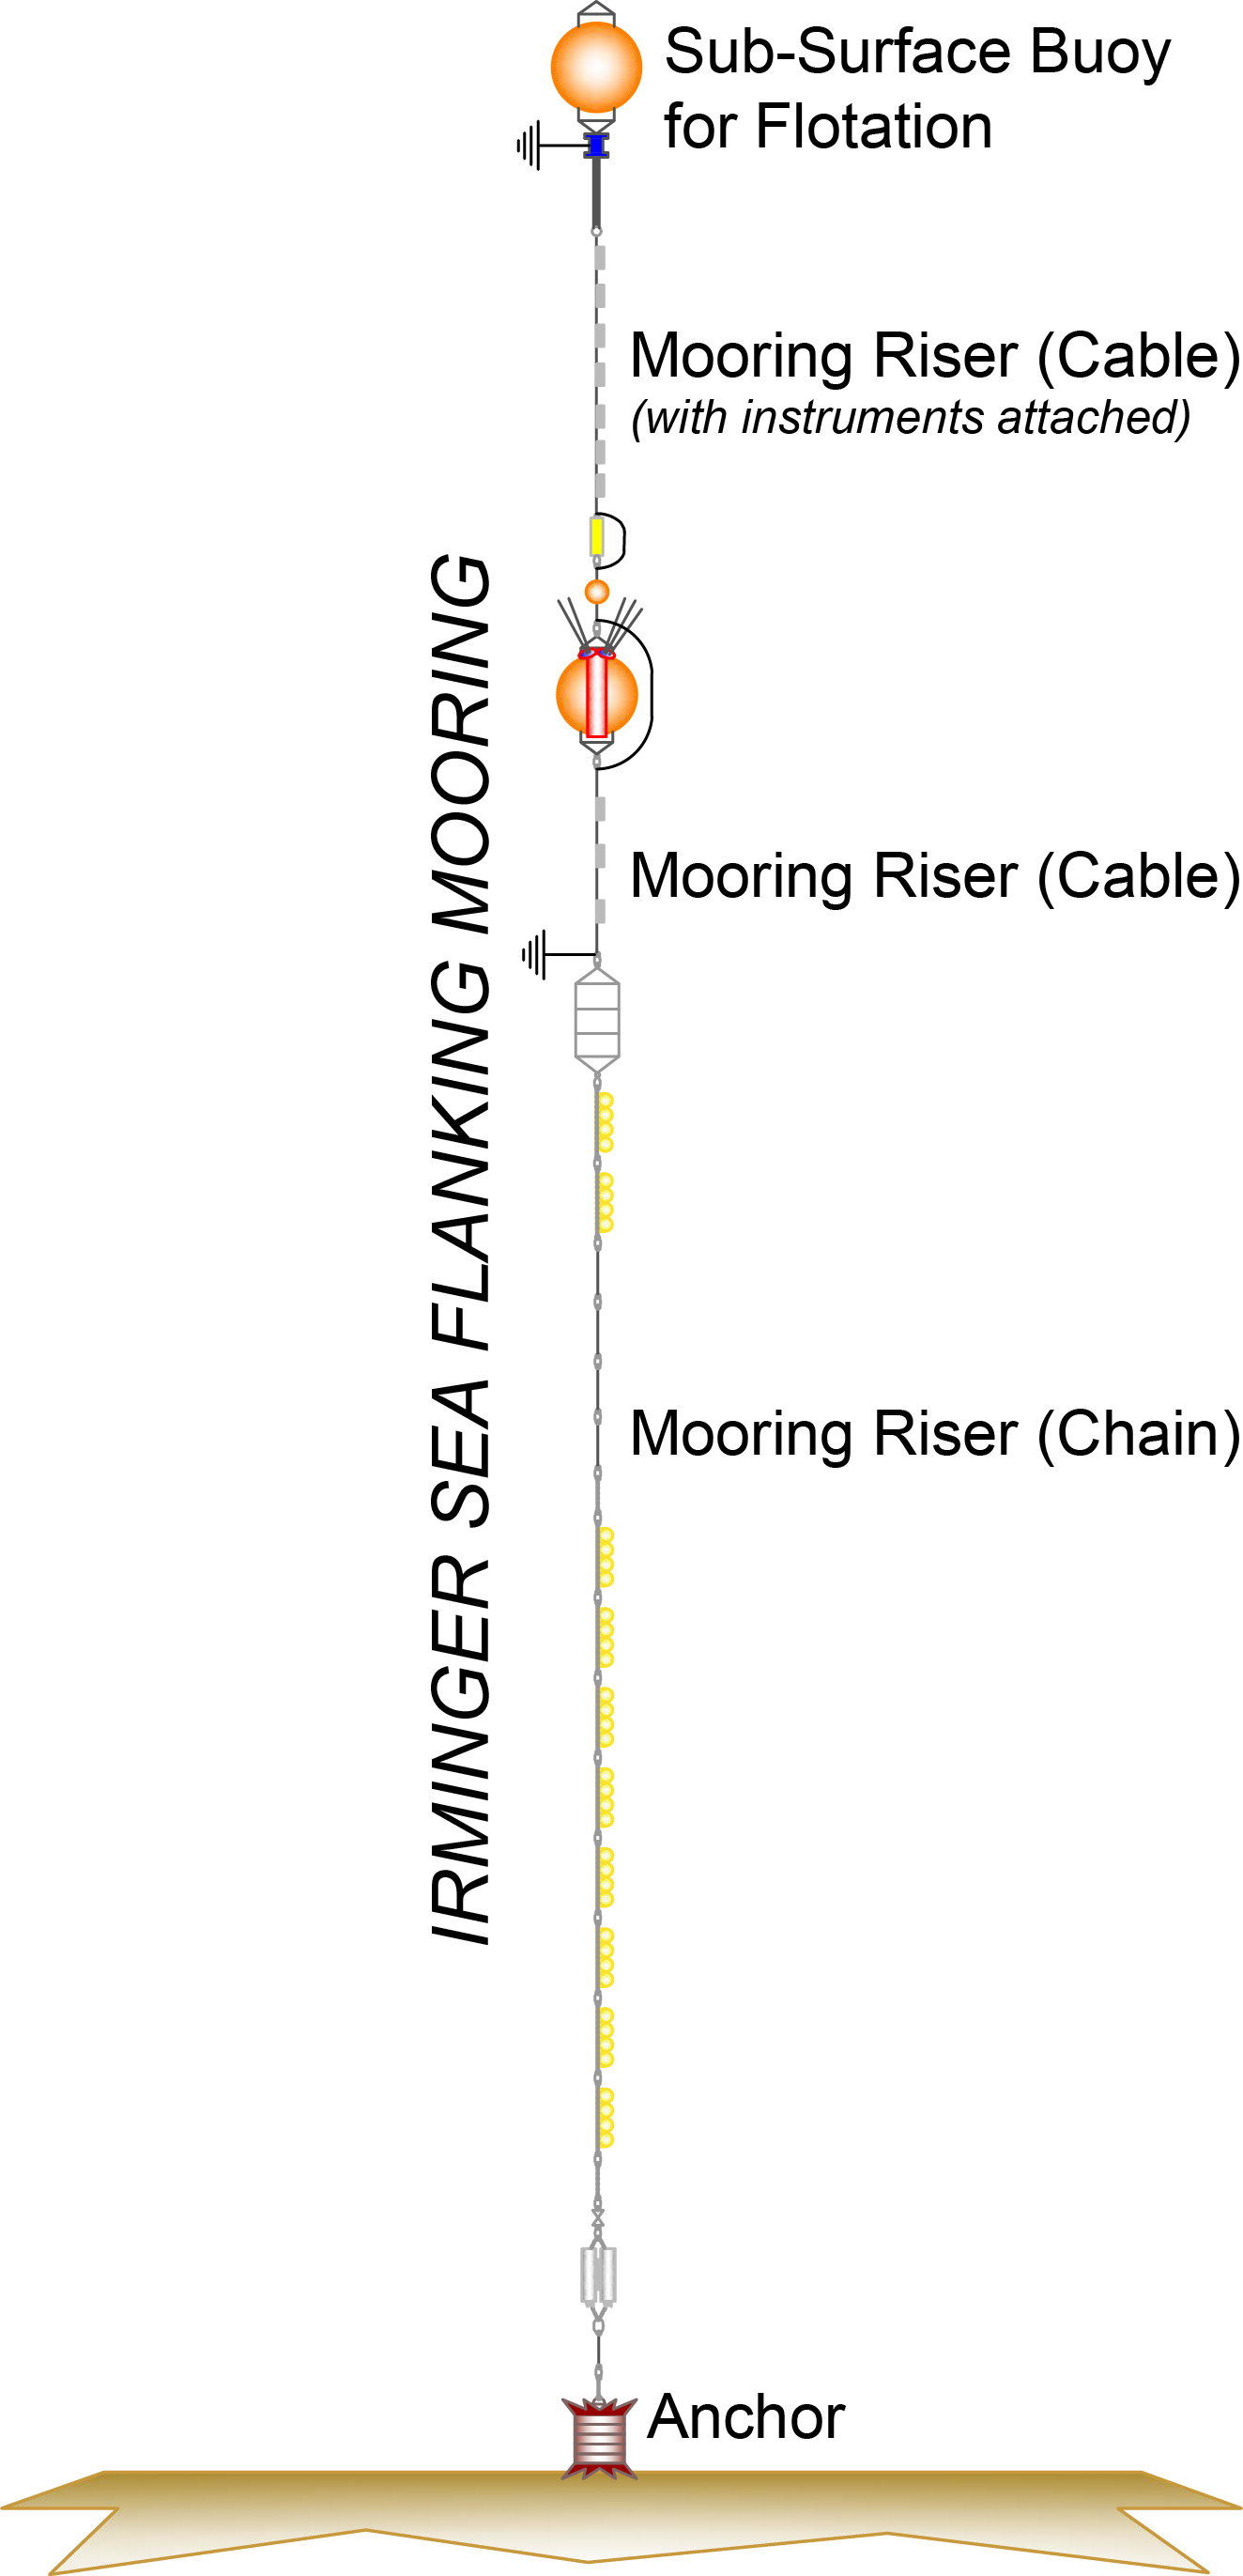
Schematic of the different elements of the Global Irminger Sea Subsurface Flanking Mooring. The 3-wavelength fluorometer is on the Sub-Surface Buoy in 30m of water.