Data Activity 3
Chlorophyll Patterns in Polar Oceans Concept Invention
Your Objective
Use chlorophyll-a concentration data, from the 3-wavelength fluorometer, over time to investigate patterns in chlorophyll-a concentrations, as a proxy for phytoplankton biomass, in the polar Atlantic Ocean (Global Argentine Basin Array) and Pacific Ocean (Global Southern Ocean Array).
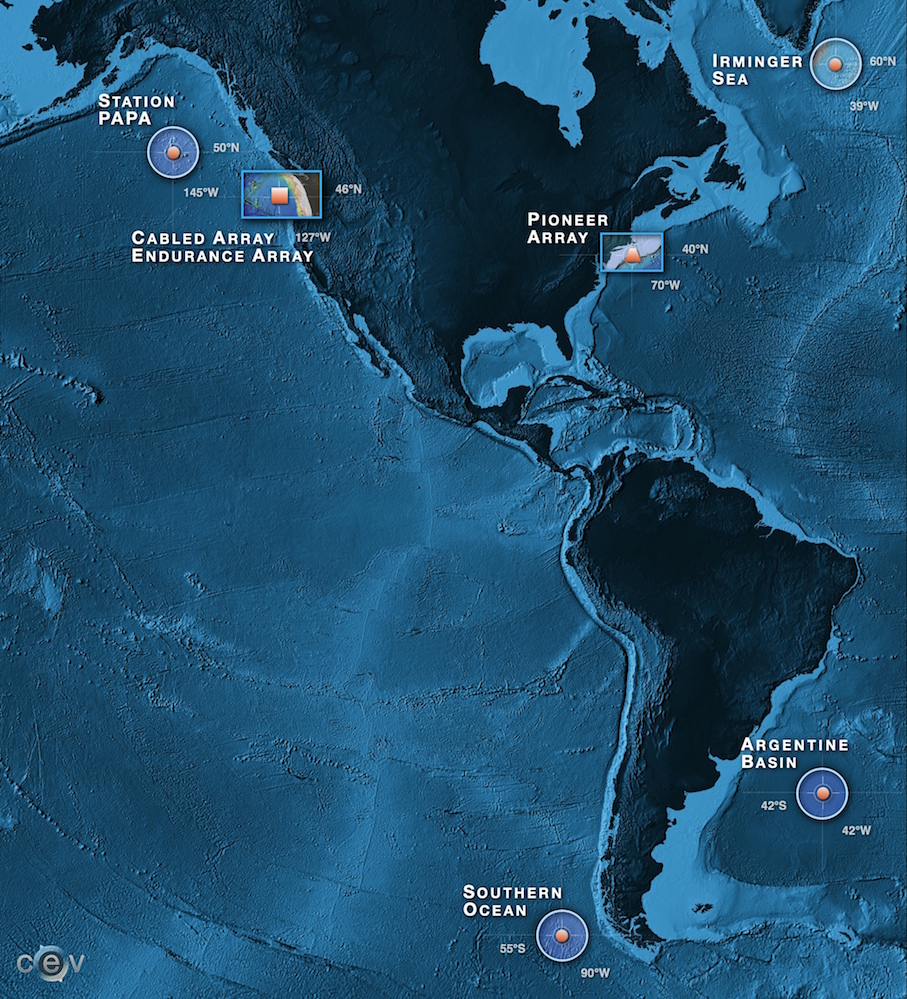
Global Argentine Basin and Global Southern Ocean are two of the seven OOI arrays throughout the Pacific and Atlantic Oceans.
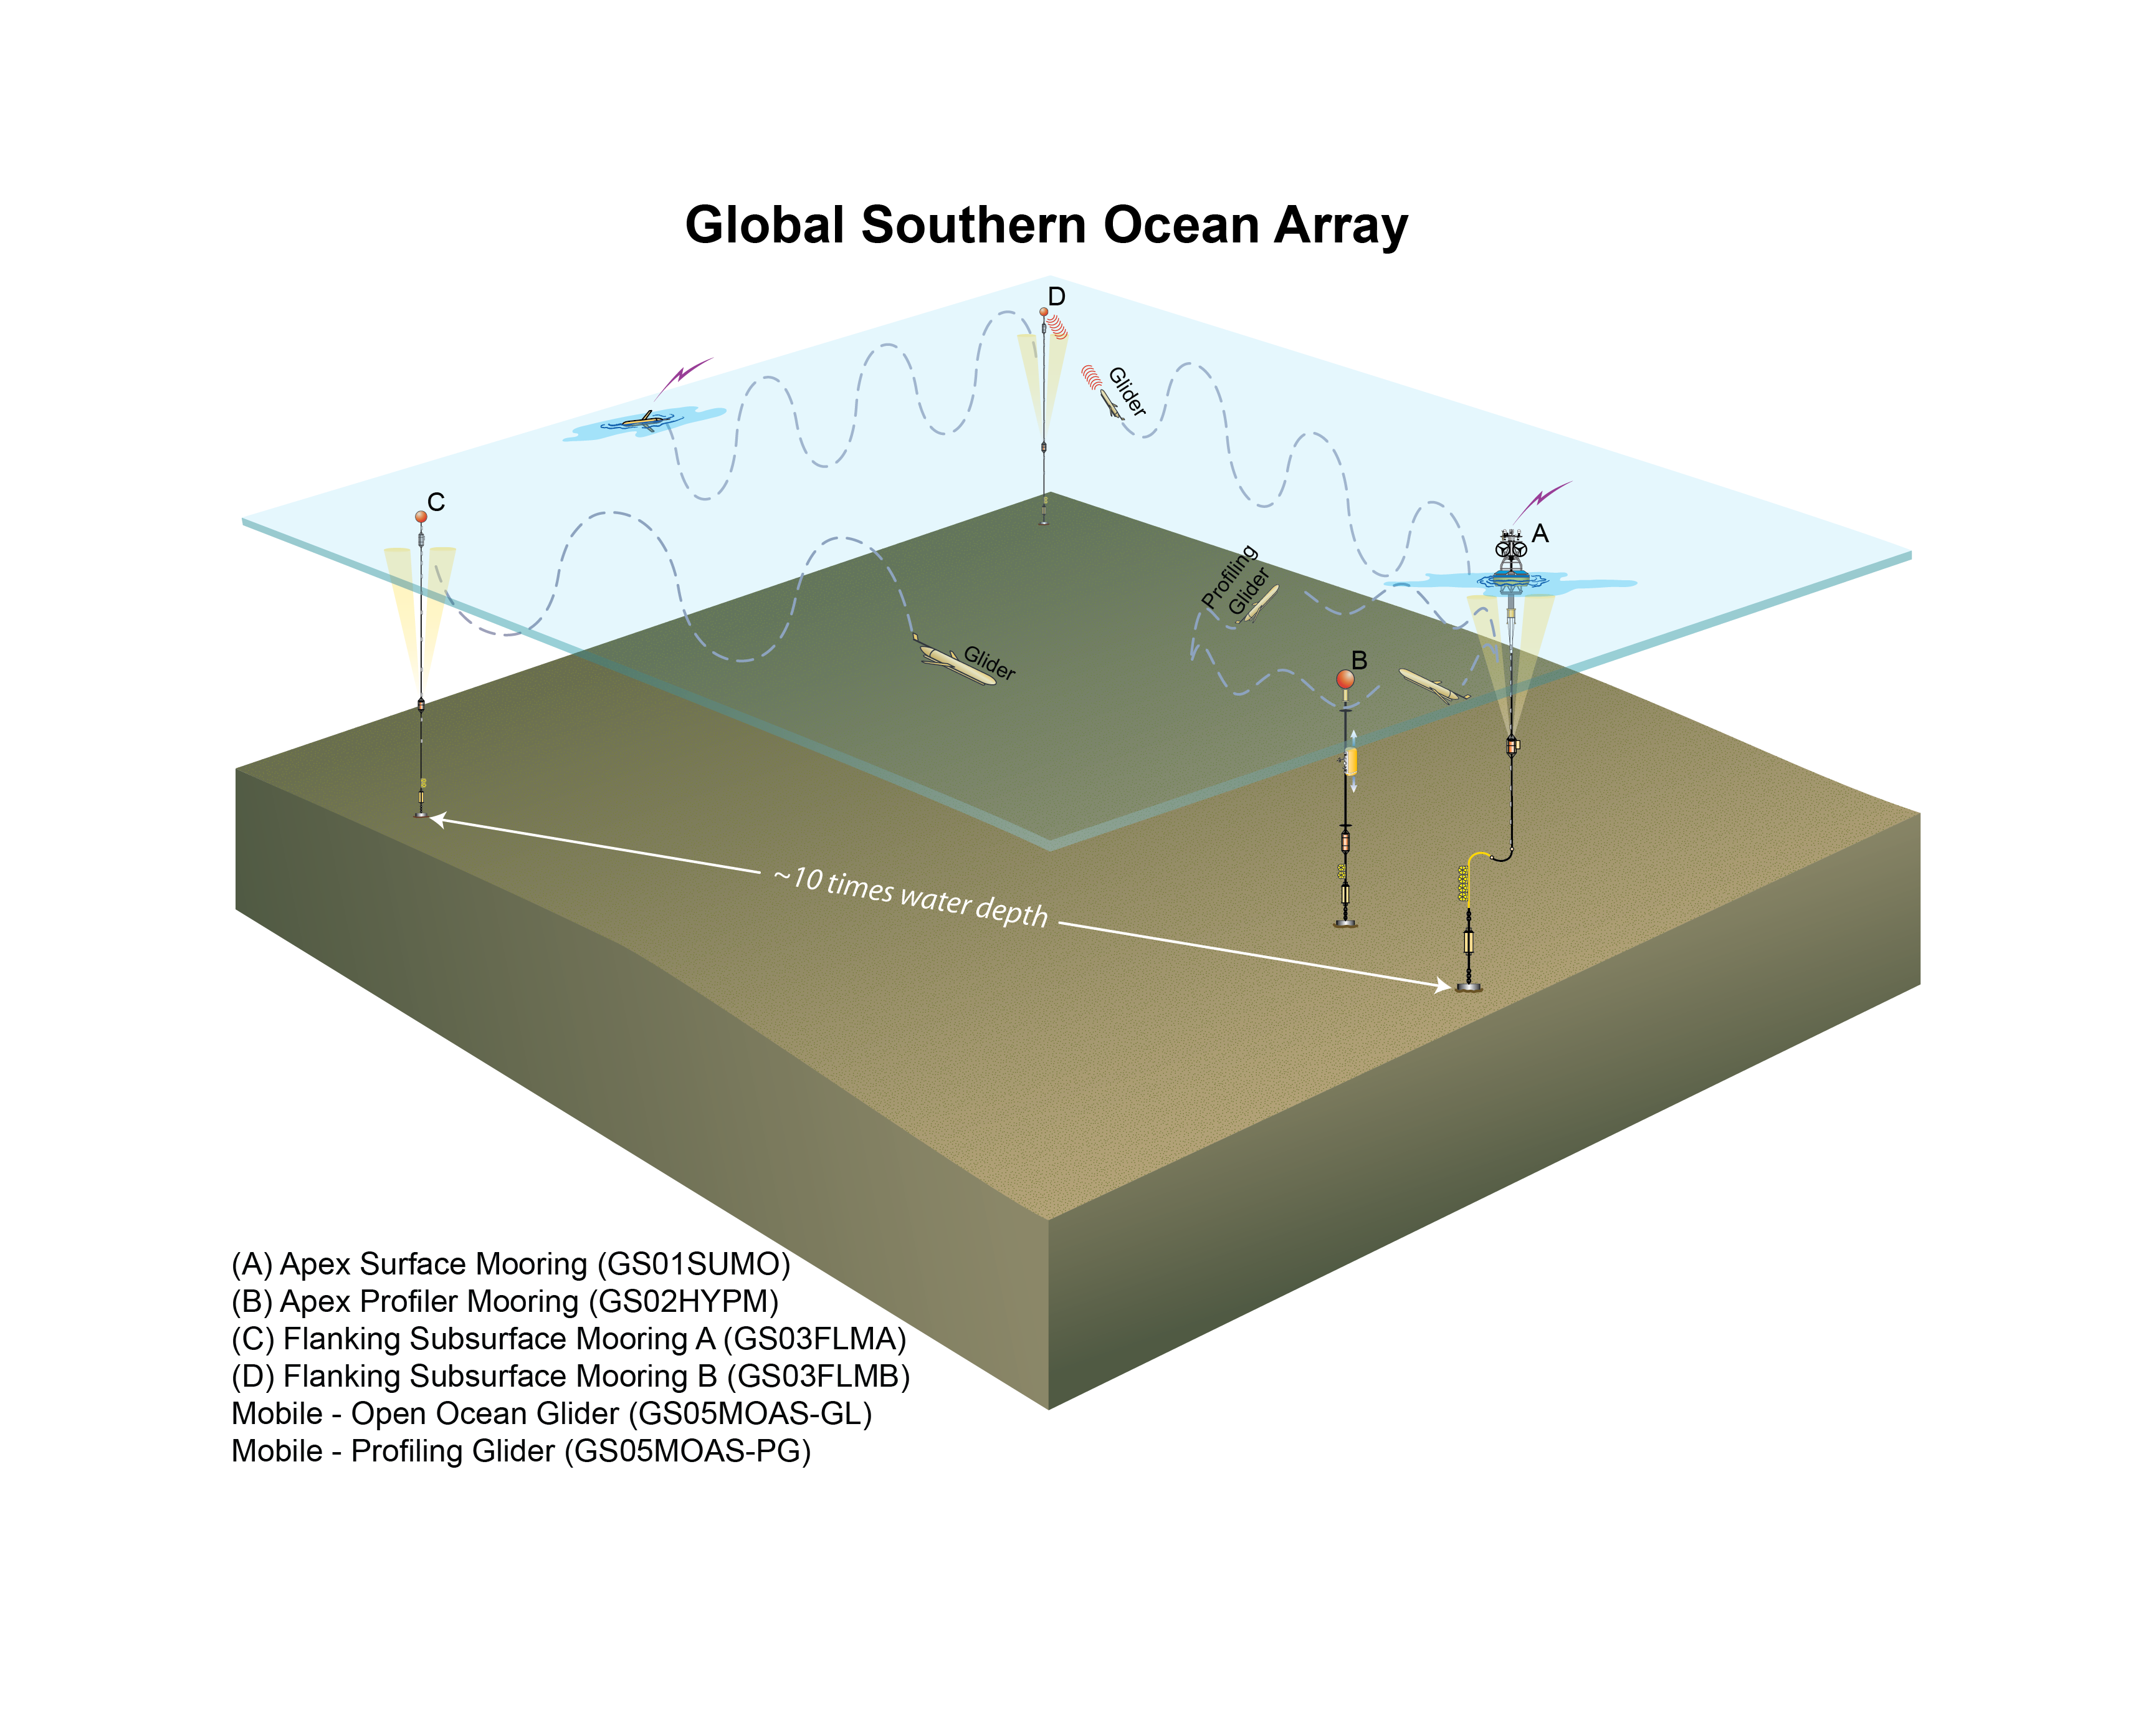
Schematic of the instruments and moorings at the Global Southern Ocean station in the Pacific Ocean. Data in this activity were collected from the Subsurface Flanking Mooring A (C).

Schematic of the instruments and moorings at the Global Argentine Basin station in the Atlantic Ocean. Data in this activity were collected from the Subsurface Flanking Mooring A (C).
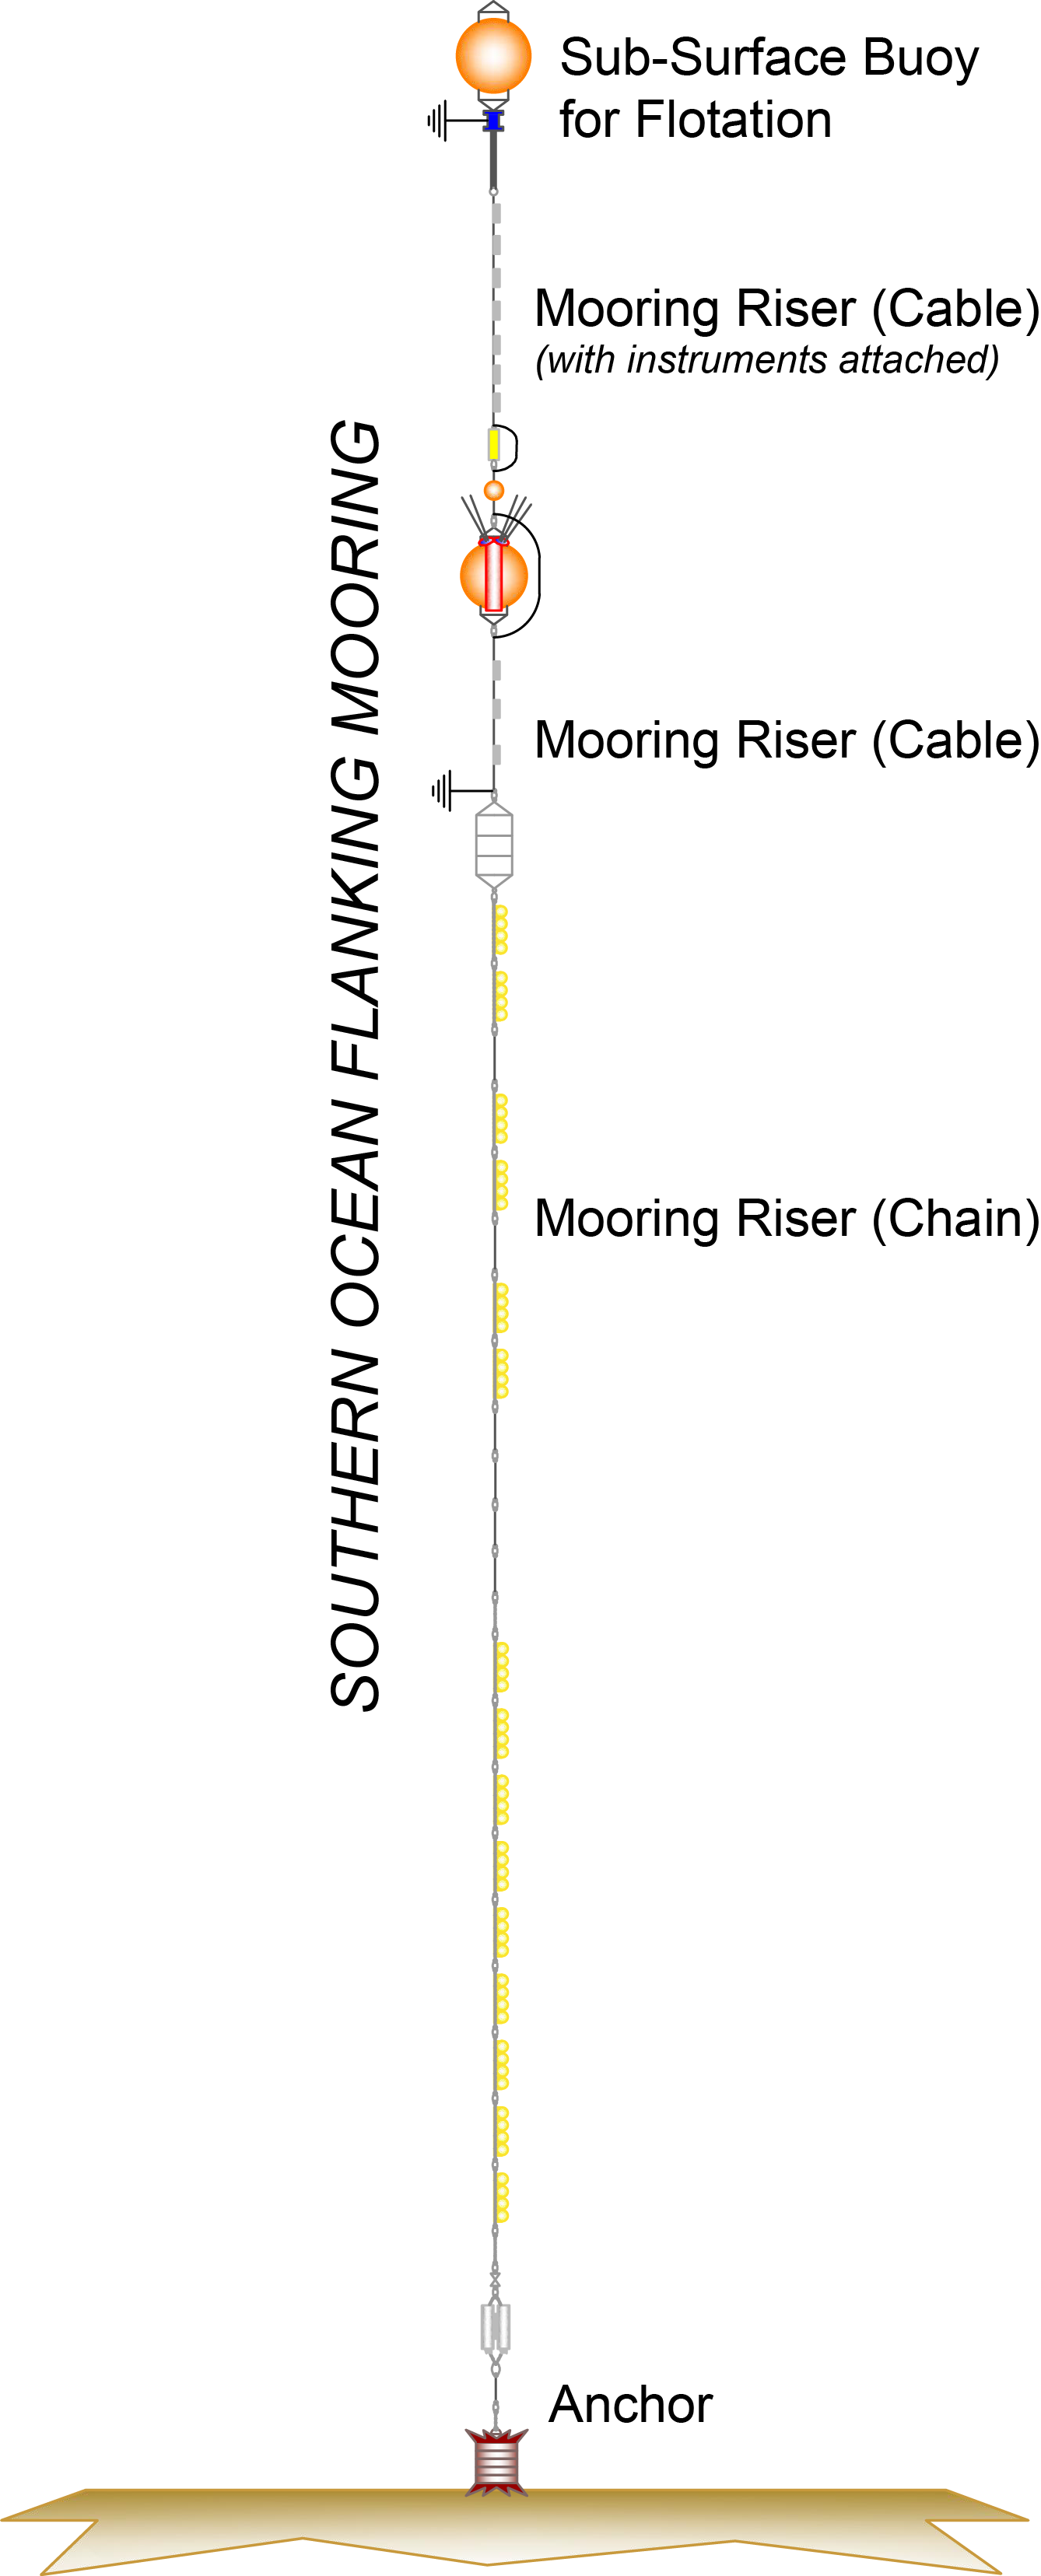
Schematic of the different elements of the Global Southern Ocean Subsurface Flanking Mooring. The 3-wavelength fluorometer is on the Sub-Surface Buoy in 30m of water.
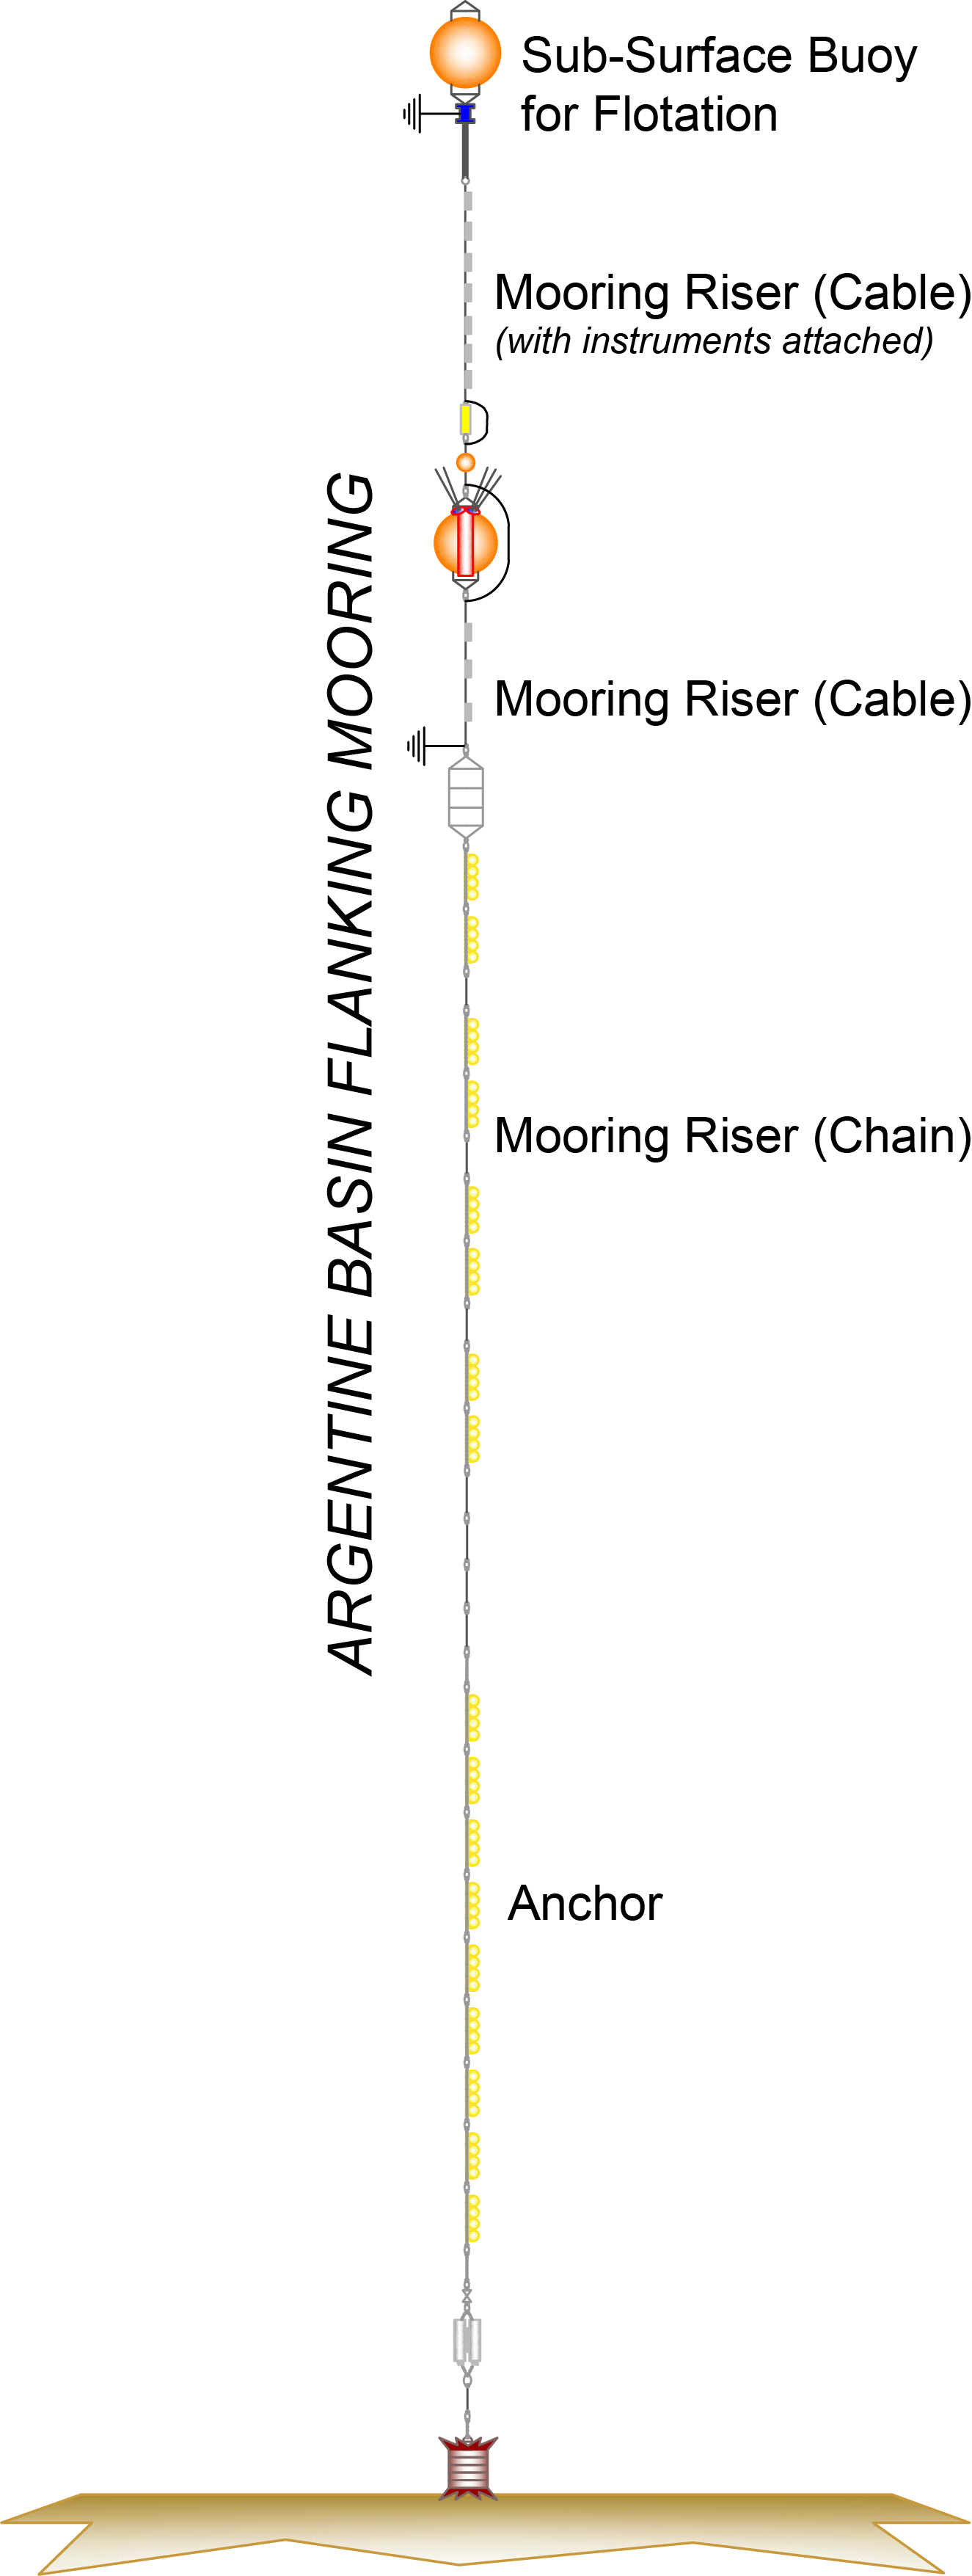
Schematic of the different elements of the Global Argentine Basin Subsurface Flanking Mooring. The 3-wavelength fluorometer is on the Sub-Surface Buoy in 30m of water.
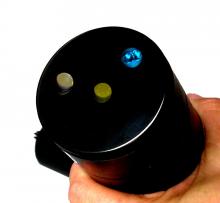
Wetlabs ECO Triplet 3-wavelength fluorometer instrument collected the data for this activity.
Challenge
What happens to the primary productivity in Polar Oceans over time?
Exploration
Investigate the Chlorophyll-a Concentration data over time from each station in the Polar Oceans.
Include datasets:
Explanation
Recall that the research challenge you are trying to address is: What happens to the primary productivity in Polar Oceans over a year?
As you consider the data you are investigating, write a reflection on the following questions:
- What did you learn about patterns in primary productivity in the Polar Oceans over time?
- What questions do you still have about primary productivity in the Polar Oceans?