Chlorophyll-a Near the Polar Zones of the Ocean Application
Challenge Question
What similarities and differences exist between patterns in chlorophyll-a concentrations from the three locations over time? How does that relate to what you know about primary production?
Choose a dataset:
Note, the graph will automatically zoom to the late summer season.
Your Objective
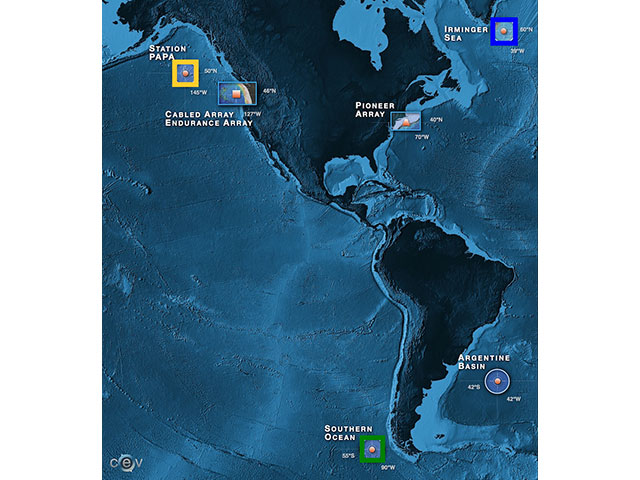
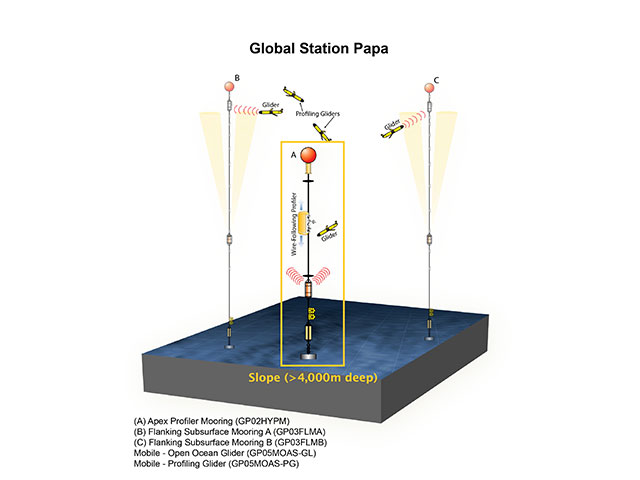
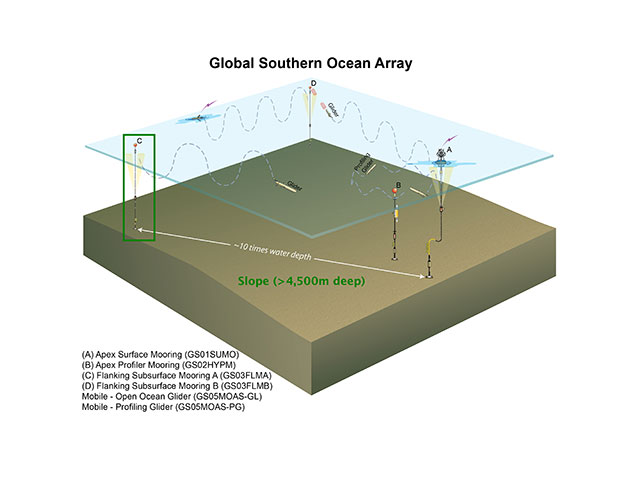
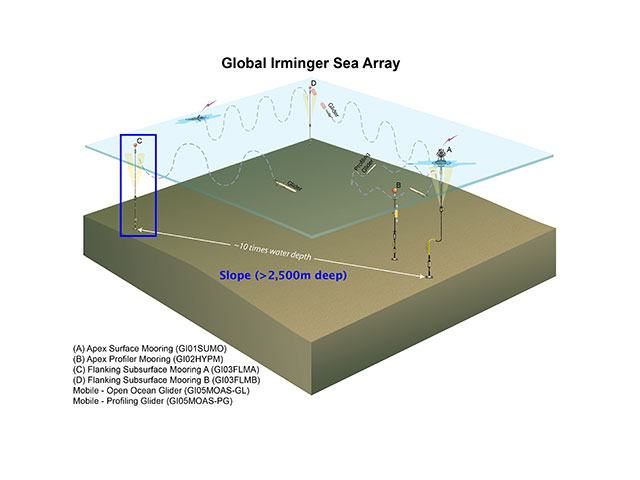
Investigate the "Chlorophyll-a Concentration" data to determine how the data vary over time among areas near the Polar Zones of the Pacific Ocean (Station Papa Array; Southern Ocean Array) and Atlantic Ocean (Irminger Sea Array).
Data Tip: Select each location to explore the data from near the Polar Zones of the Ocean. Zoom in and out of the data to look at different time scales to investigate patterns across time.
Interpretation and Analysis Questions
- Is there a relationship in primary production over time near the Polar Zones of the Ocean?
- If so, explain what kind of relationship is it? Why do you think that relationship exists for chlorophyll-a concentration over time near the Polar Zones of the Ocean?
- If not, why do you think there is no relationship for chlorophyll-a concentration over time near the Polar Zones of the Ocean?
- How does this relationship, or lack of relationship, support or challenge what you previously knew about primary production?
- What questions do you still have about primary production?
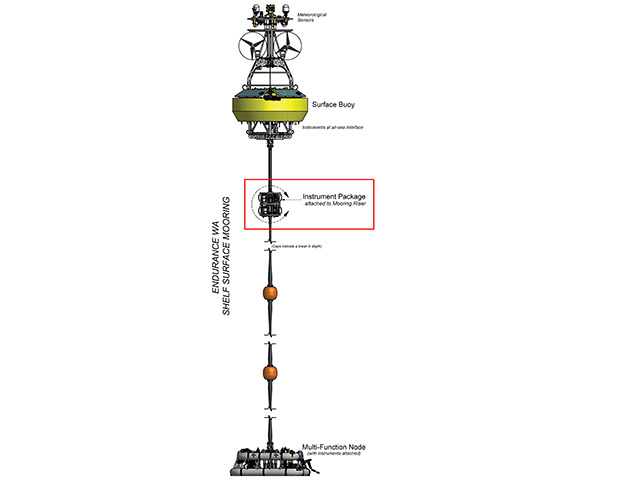
Background Information
Click on the images below to learn more about where and how the dataset above was collected.