Primary Production Variables Exploration
Challenge Question
What can we observe in the different kinds of data we collect about primary production?
Include Chlorophyll?
Select the second parameter:
Your Objective
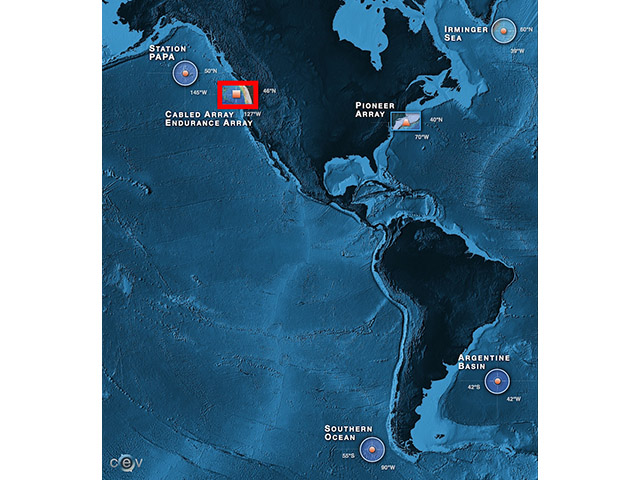
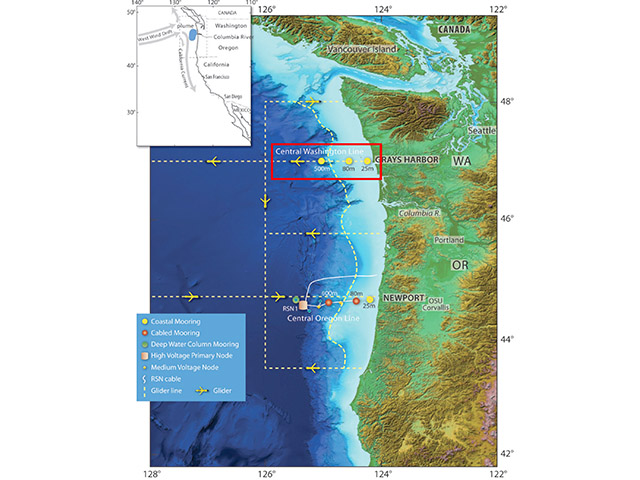
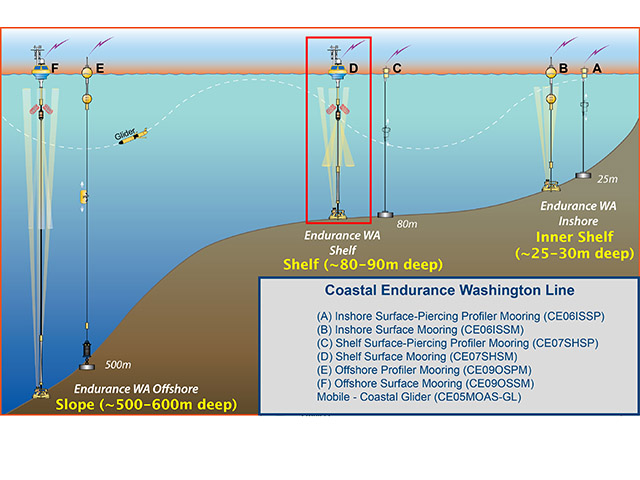
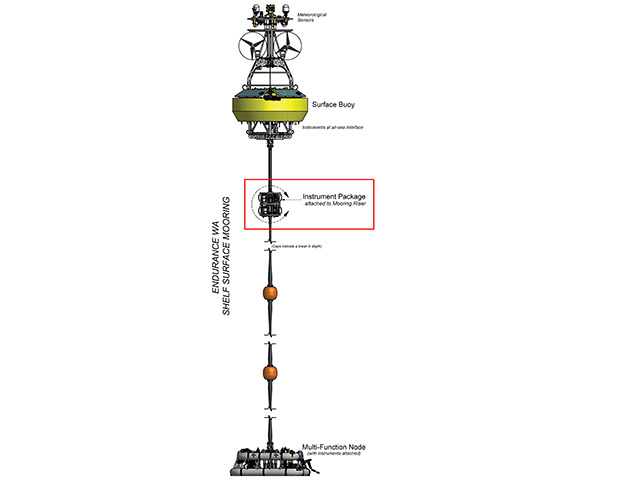
Explore different data variables collected for primary production measurements by looking at 3-wavelength fluorometer data from the Northern Pacific Ocean (Coastal Endurance Array) to see what you can observe.
Data Tip: Select another variable (in addition to the blue plotted Chlorophyll-a Concentration data) to explore the data in ways that interest you. Zoom in and out of the data to look at different time scales that interest you.
Interpretation and Analysis Questions
- What did you find interesting about what you observed in the data about primary production?
- Did you observe any patterns? If so, what were the patterns and for which variables?
- What questions do you still have about data used to look at primary production?
Background Information
Click on the images below to learn more about where and how the dataset above was collected.


