Ocean-Atmosphere Interaction During Storms
Introduction
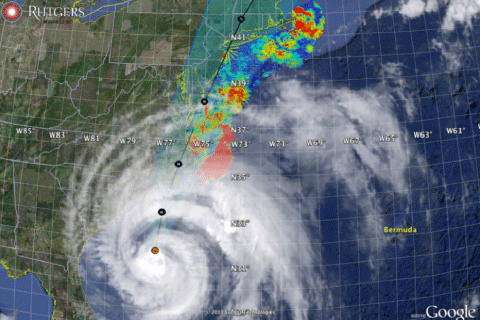
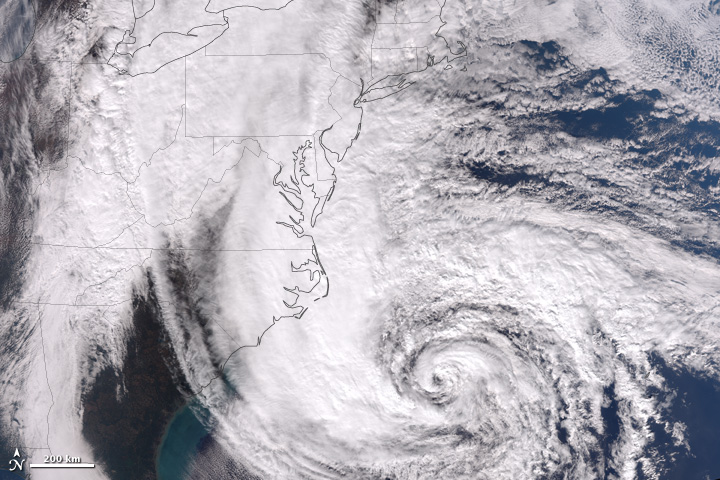
Spatial extent of Hurricane Irene, August 27, 2011.
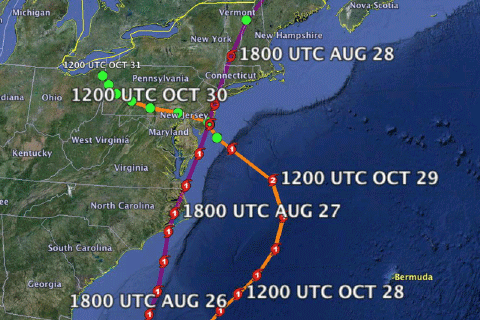
National Weather Service tracks for hurricanes Irene (purple) and Sandy (orange).
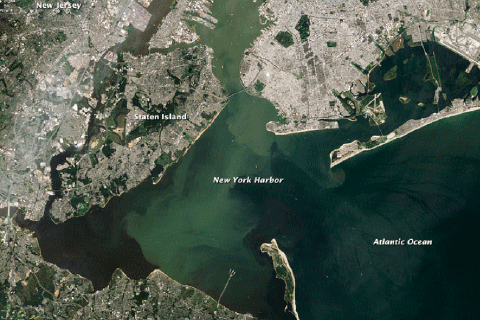
Sediment in NY Harbor following Hurricane Irene. Credit: NASA
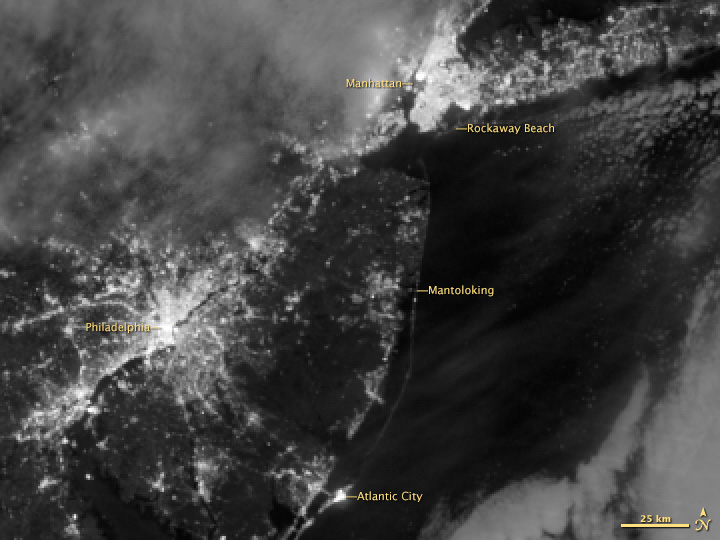
Blackout in NJ and NY following Hurricane Sandy
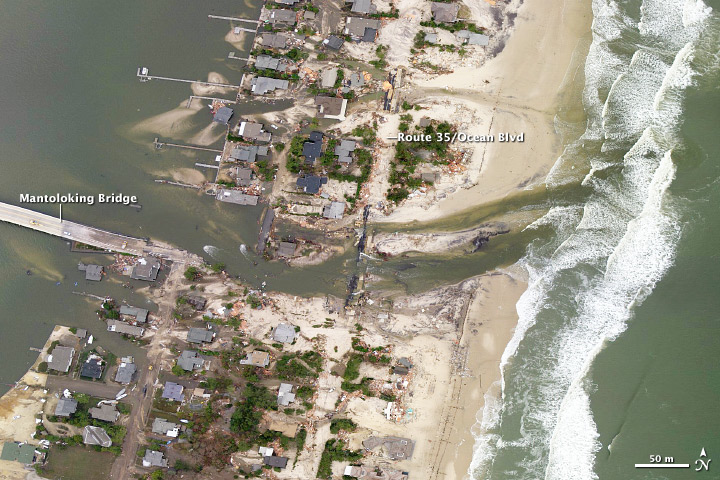
Damage to the barrier island by Hurricane Sandy in Mantoloking, NJ. Credit: NASA
Hurricanes can cause catastrophic damage to areas in their path. Atlantic hurricanes have strong impacts predominately in the Gulf Coast region and the eastern seaboard. Two devastating storms that hit the East Coast in the start of the 21st century are Hurricane Irene and Superstorm Sandy. Hurricane Irene made landfall on August 27, 2011 in North Carolina with sustained winds of approximately 137 km/h (85 mph). The storm resulted in 40 deaths and flooding records for 26 rivers. Superstorm Sandy made land fall on October 29, 2012 in New Jersey and resulted in 117 deaths. At the time of landfall Sandy had a maximum sustained winds of 130km/h (81mph). The storm surge created by Sandy was most dramatic along the New York/New Jersey coasts. The National Hurricane Center lists Sandy as the second costliest hurricane in history with damages totaling $60+ billion. To help predict and prepare for future storms, we must collect data on both atmospheric and oceanic conditions.
Background
The Length of Hurricane Sandy
The ocean plays a key role in the formation of hurricanes and is also impacted by these storms. Therefore, to help us better predict the intensity and path of future storms, scientists collect data on both the atmosphere and ocean throughout the storms. Ocean observing robots allow us to collect oceanographic data during storm events without putting scientists into harms way. The following exercise uses data that were collected in the ocean and atmosphere as Hurricane Irene and Superstorm Sandy were passing directly overhead. Data were collected by stationary buoys and free floating gliders, monitoring chances in the ocean and atmosphere. Together, these data allow us to directly observe how ocean and atmosphere interact and how the ocean responds in real time.
Challenge
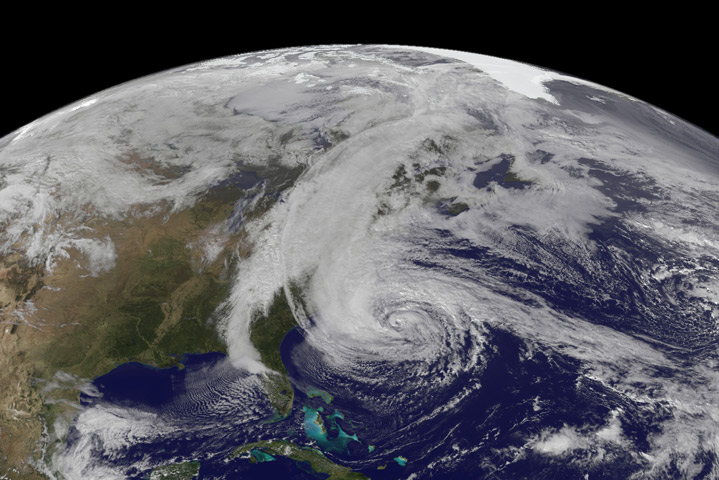
GOES View of Hurricane Sandy
In this activity you will investigate the following research challenge...
Analyze data from the gliders and buoys to identify the physical features of the ocean that changed during Hurricane Irene and Superstorm Sandy.
Explore the Data
Analyze the datasets below to determine the impacts that Hurricane Irene and Superstorm Sandy had on the ocean. Investigate each piece of evidence and answer the investigation questions for each dataset. After viewing all of the data, continue to the Explanation page for instructions on how to answer the Challenge question. You will need to justify your answers based on the evidence you review here.


When you're done investigating each dataset, continue to the last section.
Gliders: Sea-going drones
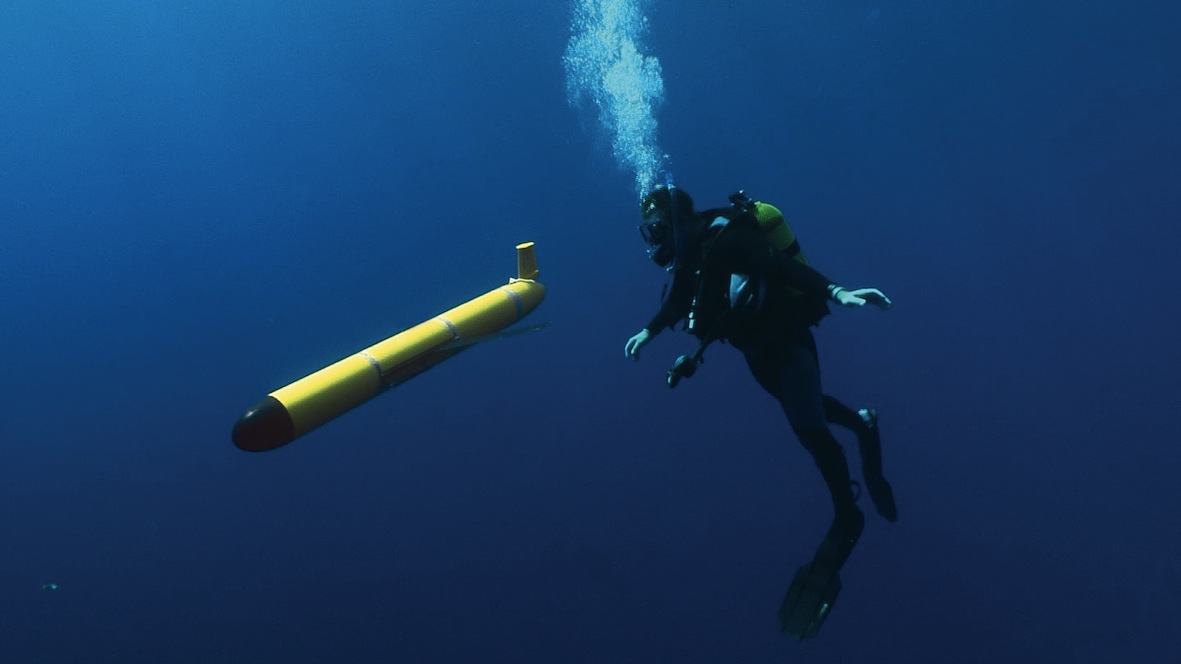
Image: A free floating glider with diver for scale.
During Hurricane Irene and Superstorm Sandy, scientists from Rutgers University sent out gliders, underwater robots, to take measurements in the ocean before, during, and after the storms. The gliders collected many types of data, including water temperature, salinity, and the number of particles dissolved in the water (backscatter) and sent it back via an iridium phone to Rutgers scientists safe on the shore.
Check out the link below to watch a short video explaining how gliders work and how they have revolutionized oceanographic data collection:
For more, check out NY Times: Ocean Drones Plumb New Depths, and this NY Times Video: Exploring the Ocean.
Glider Data from Hurricane Irene
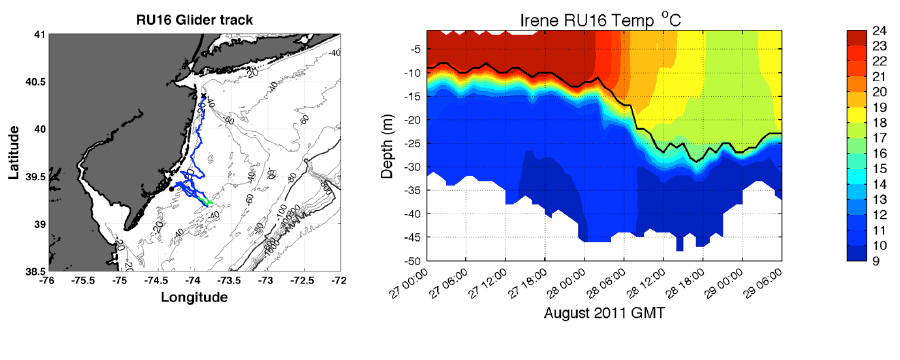
The graph on the left shows the track taken by an underwater glider called RU16 as it travelled along the coast of New Jersey before, during and after Hurricane Irene passed through the area.
The graph on the right shows the temperature section for the portion of the glider track marked in green. Think of this section as a slice taken out of the ocean, where the y-axis is the depth of the water, the x-axis is the time the measurement was taken (which corresponds to the travel path of the glider) and the temperature of the water at each point is colored.
The black line is the depth of the surface mixed layer.
Interpretation Questions
- How did the water temperature in the ocean change as the storm passed? Did it change similarly for all depths?
- How did the mixed layer depth change?
- What factors might have played a role in these changes?
Glider Data from Superstorm Sandy
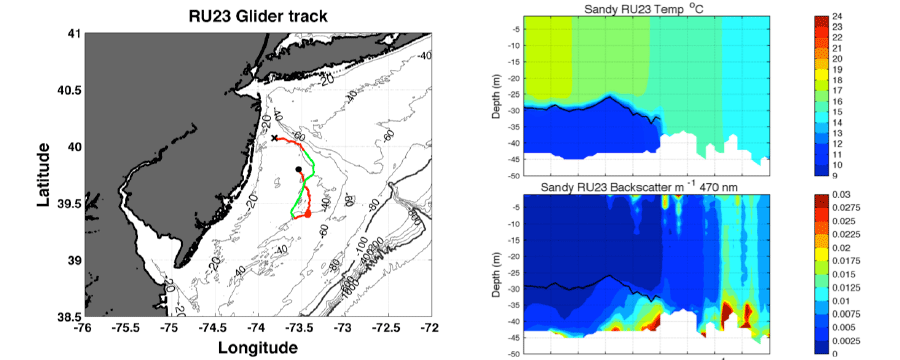
The graph on the left above shows the track taken by an underwater glider called RU23 as it travelled along the coast of New Jersey before, during and after Hurricane Sandy passed through the area.
The graph on the right shows the temperature and backscatter data collected by the glider for the portion of the glider track marked in green.
The black line is the depth of the surface mixed layer.
Backscatter is a measure of the amount of small particles suspended in the water column. They could be inorganic material like sediment, or organic like phytoplankton.
Interpretation Questions
- How did the water temperature in the ocean change as the storm passed? Did it change similarly for all depths?
- How did the mixed layer depth change?
- How did the backscatter change over time?
- What factors might have played a role in these changes?
Buoys: Oceanic weather stations
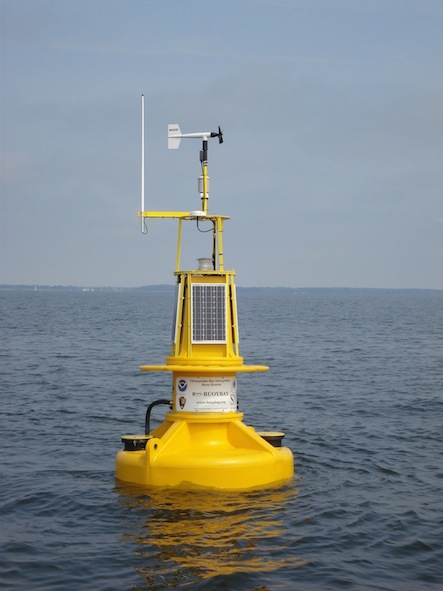
Scientists from the National Oceanic and Atmospheric Administration (NOAA) have placed buoys in the water along the entire U.S. east coast, which continuously measure atmospheric and oceanic properties. These buoys took measurements throughout both Irene and Sandy.
Check out this link for more information about the NOAA buoy network:
Click here for NOAA's National Data Buoy Center.
Image: A moored (stationary) NOAA buoy, collecting data from the ocean and atmosphere.
NOAA buoy observations of Hurricane Irene
The interactive feature above allows you to investigate several variables measured by NOAA buoys deployed off the Mid-Atlantic coast. The two buoys we will examine for Hurricane Irene are:
44065 Offshore NY/NJ,
44009 Delaware
Use the interactive feature to investigate the oceanic and atmospheric conditions before, during and after Hurricane Irene traveled through the region. Note, data may not be available for all buoys at all times.
Interpretation Questions
- As the storm passes over each mooring, what happens to each variable (wind, waves, and water temperature) before, during and after the storms?
- What relationships are there, if any, between wind, waves, and water temperature?
NOAA buoy observations of Superstorm Sandy
The feature interactive above allows you to investigate several variables measured by NOAA buoys deployed off the Mid-Atlantic coast. For Superstorm Sandy we have data from four buoys (from North to South):
44027 Jonesport, Maine,
44025 NY Harbor Entrance,
44065 Offshore NY/NJ,
44009 Delaware
Use the interactive feature to investigate the oceanic and atmospheric conditions before, during and after Superstorm Sandy traveled through the region. Note, data may not be available for all buoys at all times.
Interpretation Questions
- As the storm passes over each mooring, what happens to each variable (wind, waves, and water temperature) before, during and after the storms?
- What relationships are there, if any, between wind, waves, and water temperature?
Develop an Explanation
Recall that the research challenge you are trying to address is:
Analyze data from the gliders and buoys to identify the physical features of the ocean that changed during Hurricane Irene and Superstorm Sandy.
As you consider the data you just investigated, consider the following questions:
- As Hurricane Irene moved closer to shore, what changes did you notice in the ocean?
- As Superstorm Sandy moved closer to shore, what changes did you notice in the ocean?
- Based on your observations, what is the relationship between storms and the ocean?
- Explain the differences in mixed layer depths between the two storms as they moved closer to land. Why are they different?
- If Hurricane Sandy had occurred a couple weeks earlier in the season when atmospheric temperatures were warmer, how do you think the storm would have been different?
Assessment
Additional Instructions
Using the datasets provided, describe the impact that Hurricane Irene and Superstorm Sandy had on the ocean. Include an analysis of how the oceanic response varied between the two storms.