Seasonality in the Ocean
Introduction
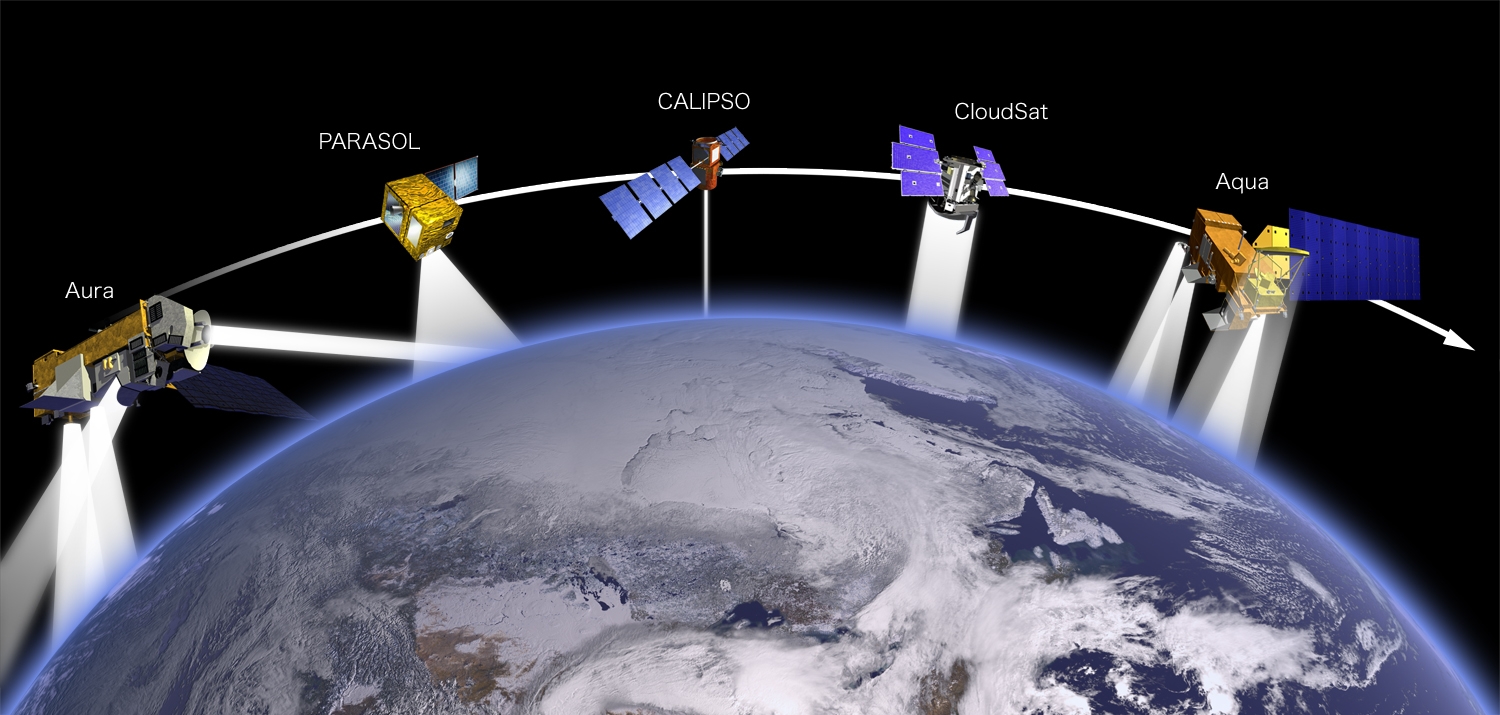
These NASA satellites are used to collect data on various features on Earth. Some of the satellites shown are no longer functioning.
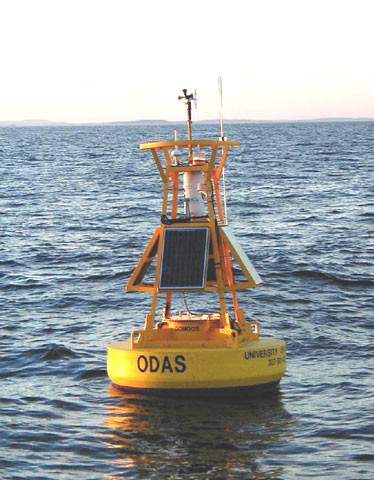
Buoys like this one from the National Oceanographic and Atmospheric Administration (NOAA) are deployed throughout the ocean. They monitor the ocean and atmosphere over time at a fixed location. Credit: NOAA
Remotely sensing systems, such as satellites and remote buoys, allow us to collect data about the ocean without experiencing seasickness and/or the overwhelming costs of sending out a research vessel. The information collected using this technology can be used in many ways, from disaster management to weather monitoring to locating optimal fishing zones. More specifically, satellites and buoys can be used together to gain information on the primary productivity and temperature of the ocean.
Water temperature and primary productivity are of great importance to both scientists and non-scientist alike. Primary producers in the ocean (i.e. phytoplankton) produce huge amounts of oxygen on Earth, play a major role in the Carbon Cycle and are a fundamental link in the marine food web. Likewise, water temperature is not only important to those of us who want to go swimming, but is also important in how it effects density and ocean circulation. Because water temperature and primary productivity are so important, it is important that we monitor how they change over time and space as well as what causes these changes.
Background
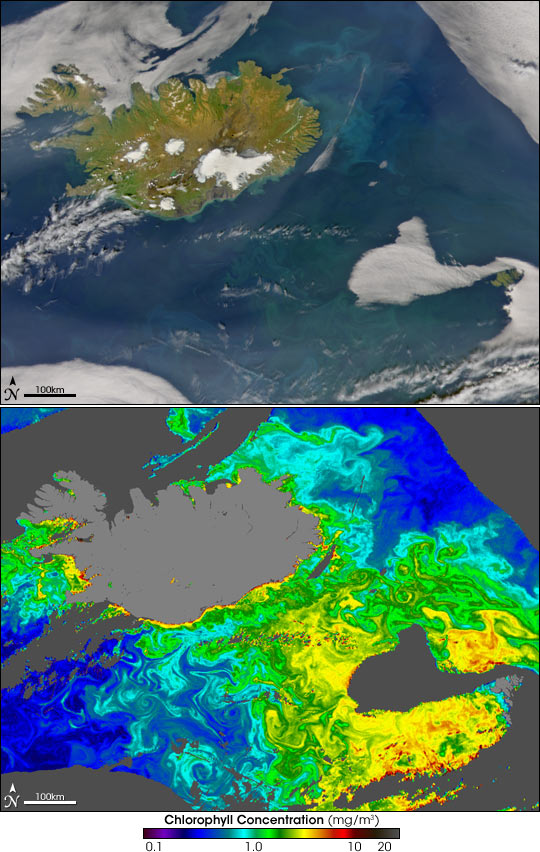
An example comparing a true color image (the data collected by the satellite) and the false color image that was created to visualize the data. Credit: NASA
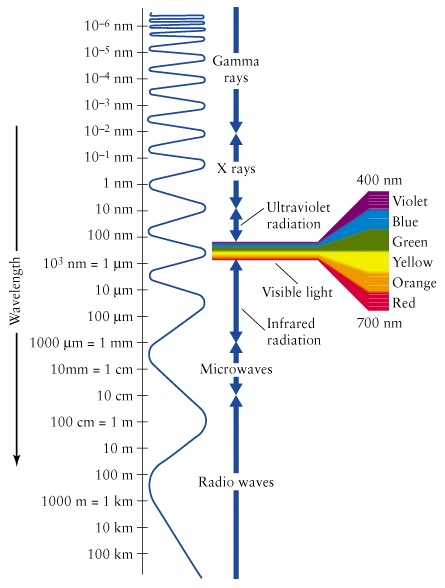
Sea surface temperature is determined using the infrared radiation from the ocean surface. This figure provides information on the wavelength of infrared radiation and shows where it falls on the electromagnetic spectrum. Credit: NASA

Microscopic phytoplankton, like these diatoms, contain the photosynthetic pigment chlorophyll. Credit: Wikipedia
Ocean color is a satellite measure of how much chlorophyll is in the ocean. Since chlorophyll is a photosynthetic pigment found in primary producers like phytoplankton, scientists use this an indicator of the amount of primary production in the ocean. The data collected by satellites on ocean color are often converted into a false color map. False color maps are created as a visual tool to observe patterns and differences within the data. These maps are not in true-life color nor are they photographs/pictures.
Satellites are also used to measure Sea Surface Temperature (SST). The satellites record the infrared radiation from the ocean surface in several different wavelengths to get the temperature. Like chlorophyll, these data are also presented as a false color map.
Along with satellite data, scientists also rely on data collected by buoys in the water to gather information. The National Data Buoy Center (NDBC), an agency within the National Weather Service (NWS) of the National Oceanic and Atmospheric Administration (NOAA), has deployed over 100 buoys off the coast of the United States. These buoys continuously measure atmospheric and oceanic properties, including water temperature, at fixed locations.
Question 1: Do you think that there would a change in the amount of primary production in the ocean throughout the year at a location? If so, why?
Question 2: Do you think that there would a change in the temperature in the ocean throughout the year at a location? If so, why?
Question 3: Would the amount of primary production and ocean temperature be the same everywhere in the ocean at the same point in time?
Challenge
Seasonal Sea Surface Temperature
In this activity you will investigate the following research challenge...
In this activity, you will look at seven-year composites for January, April, July, and October of Sea Surface Temperature (SST) and ocean color (chlorophyll concentrations) in the Mid-Atlantic Bight region. Each month was chosen to represent a season. You will also investigate data collected by buoys in three different locations. Analyze these data to describe any trends or patterns that you see in ocean primary productivity and water temperature by season and among the three locations.
Explore the Data
Analyze the datasets below to determine the changes in primary productivity and water temperature in the ocean. Investigate each piece of evidence and answer the investigation questions for each dataset. After viewing all of the data, continue to the Explanation page for instructions on how to answer the Challenge question. You will need to justify your answers based on the evidence you review here.


When you're done investigating each dataset, continue to the last section.
Seasonal Chlorophyll Concentrations
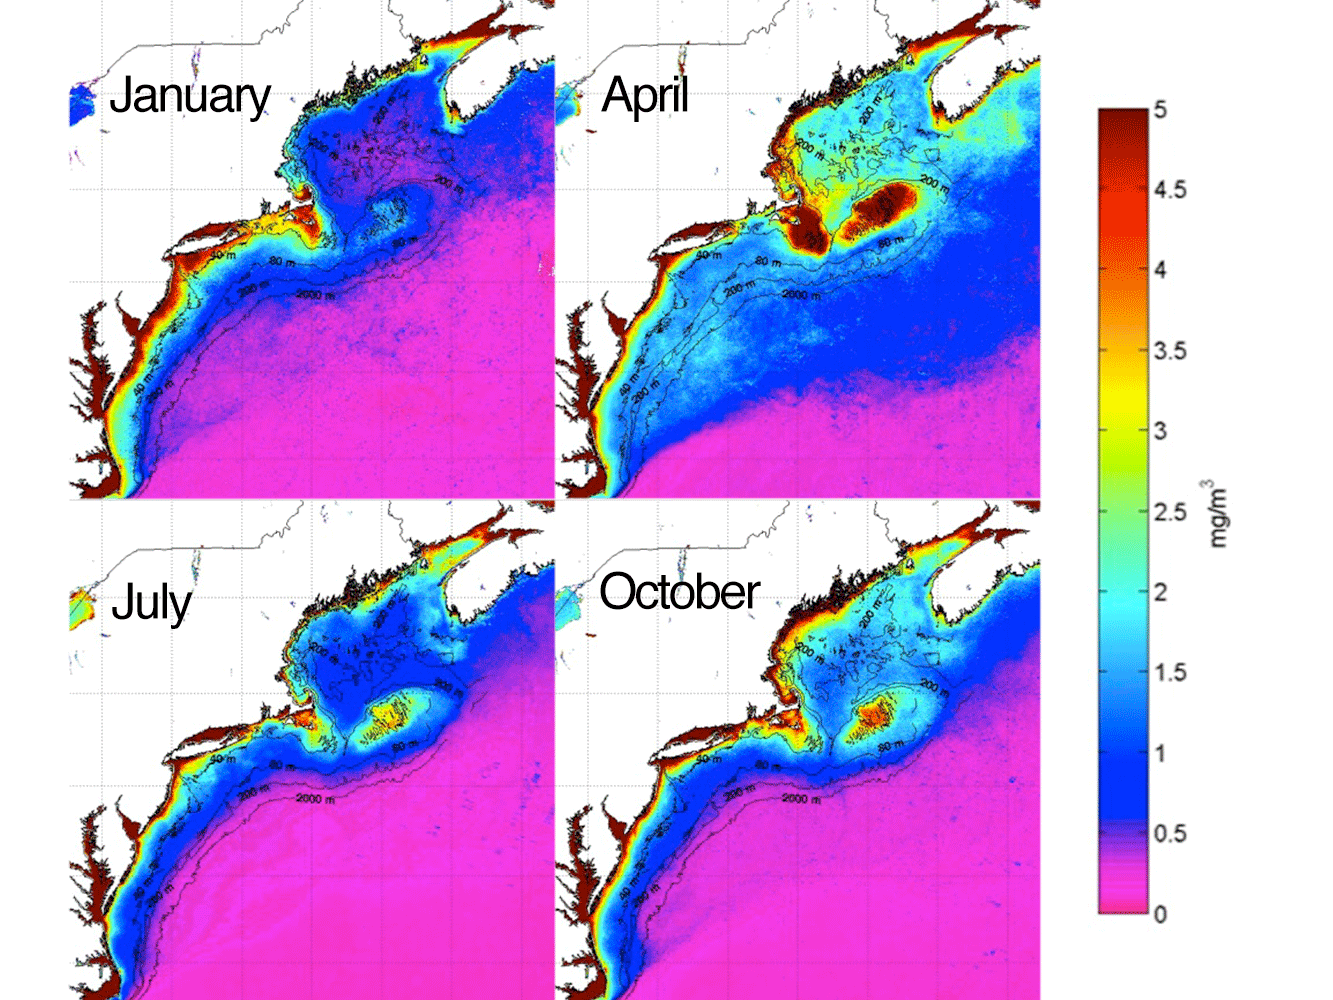
These satellite images show the concentration of chlorophyll during 4 different months of the year.
Interpretation Questions
- Within each month, is the amount of chlorophyll the same everywhere? If not, where are the areas with higher chlorophyll levels? Lower chlorophyll levels?
- Compare the amount of chlorophyll between the four months. Which month has the highest chlorophyll levels?
Seasonal Sea Surface Temperature
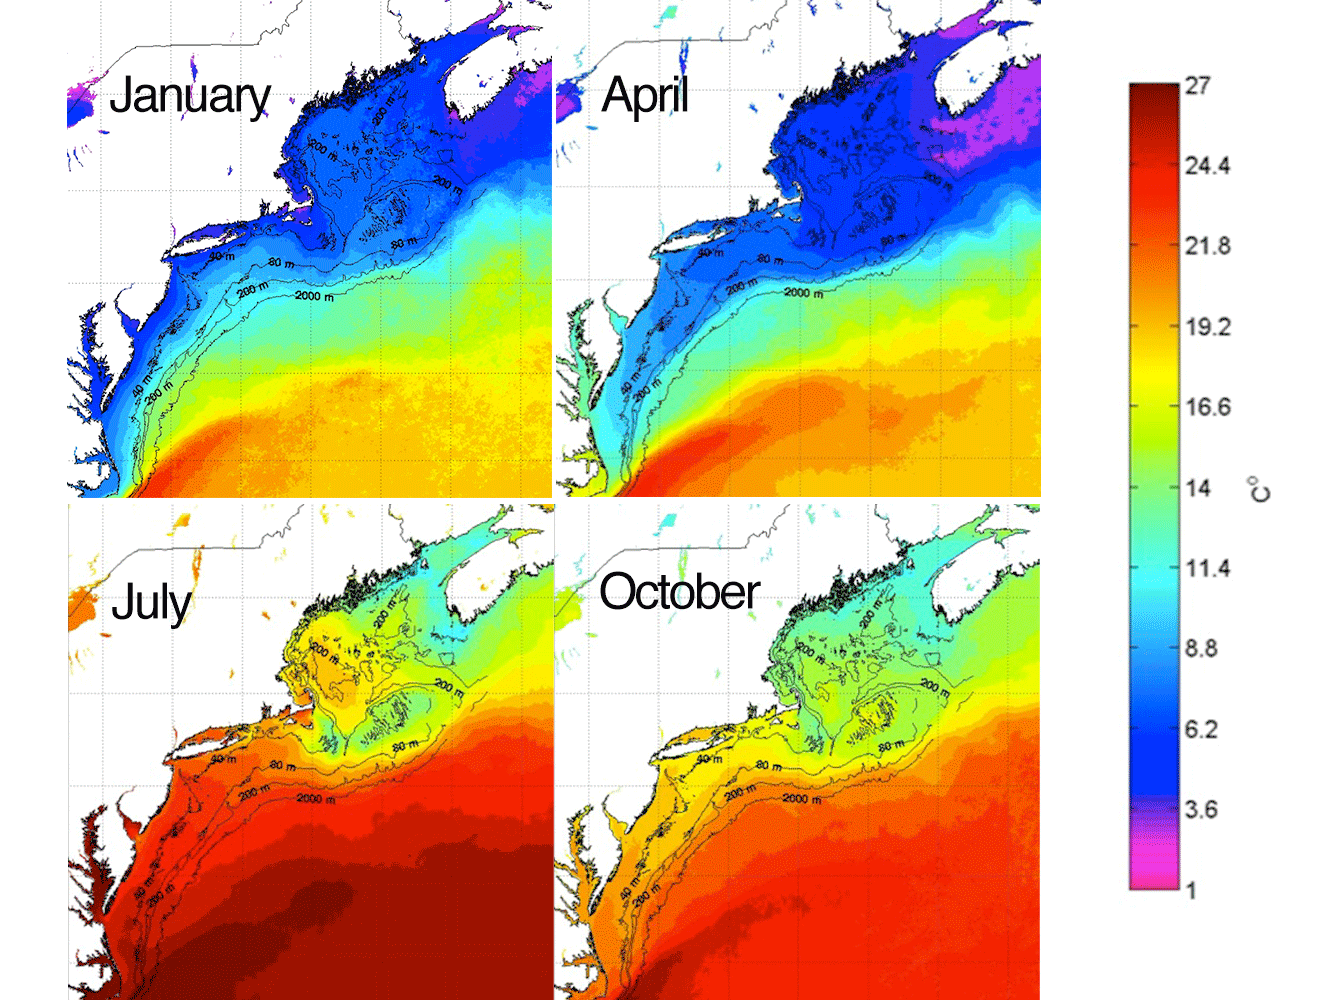
These satellite images show the temperature at the sea surface during 4 different months of the year.
Interpretation Questions
- Within each month, is the temperature the same everywhere? If not, what areas are warmer? Cooler?
- Compare the temperature between the four months. Which month has the highest temperature levels? Lowest temperature levels?
Water Temperatures Off the Coast of FL, NJ & ME
The interactive above allows you to investigate water temperature measured at NOAA buoys deployed off the coast of Florida (41112), New Jersey (44065), and Maine (44033). Use the interactive to investigate the water temperature data throughout 2013.
Interpretation Questions
- 1) What is the water temperature range during January, April, July, and October in the three locations?
- 2) What 3 months, or season, have the highest and lowest water temperatures at each location?
- 3) What relationship, if any, do you see between the water temperature data and the location throughout the year?
- 4) Were there any values in the data at the three locations that you thought might be anomalies (irregular or unexpected)? Why?
- 5) What could account for anomalies in the data?
Develop an Explanation
Recall that the research challenge you are trying to address is:
In this activity, you will look at seven-year composites for January, April, July, and October of Sea Surface Temperature (SST) and ocean color (chlorophyll concentrations) in the Mid-Atlantic Bight region. Each month was chosen to represent a season. You will also investigate data collected by buoys in three different locations. Analyze these data to describe any trends or patterns that you see in ocean primary productivity and water temperature by season and among the three locations.
As you consider the data you just investigated, consider the following questions:
- What trends or patterns did you observe in ocean primary productivity and water temperature throughout the year? Was there a relationship between these two factors?
- What trends or patterns did you observe in ocean primary productivity and water temperature within each month? Was there a relationship between these two factors?
- Throughout each season, what similarities/differences did you observe in the water temperature off the coast of North Carolina, New Jersey, and Maine?
- How may these data compare to the air temperature and levels of primary production that you would expect to see on land during these months?
- What other data could you look at that would show changes in seasons in the ocean?
Assessment
Additional Instructions
Using the datasets provided, describe how the primary production and water temperature changes throughout the year. Cite evidence from the chlorophyll, Sea Surface Temperature maps, and buoy data in your answer. Also, include an analysis of any spatial differences of water temperatures within each month and among locations (off the coast of North Carolina, New Jersey, and Maine).