The Spatial Response from Hurricane Sandy
Introduction

This image, from Suomi NPP, acquired at 1:35 pm ET on October 29, 2012, shows Hurricane Sandy as it approaches the U.S. coastline.
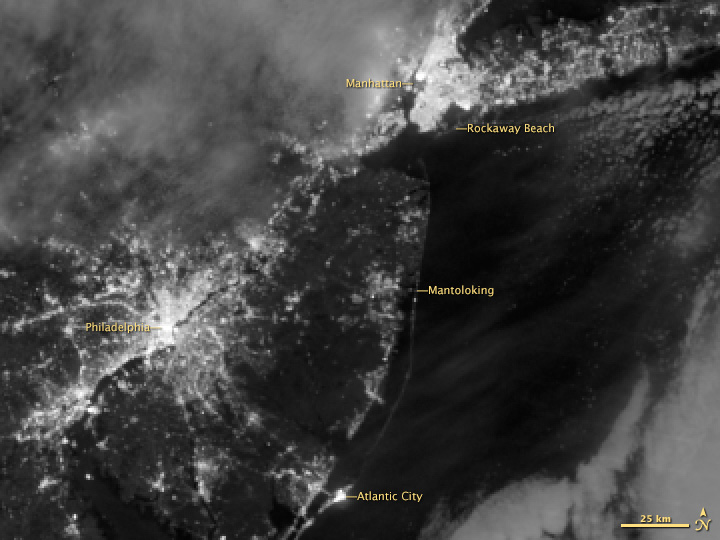
Blackout in NJ and NY following Hurricane Sandy
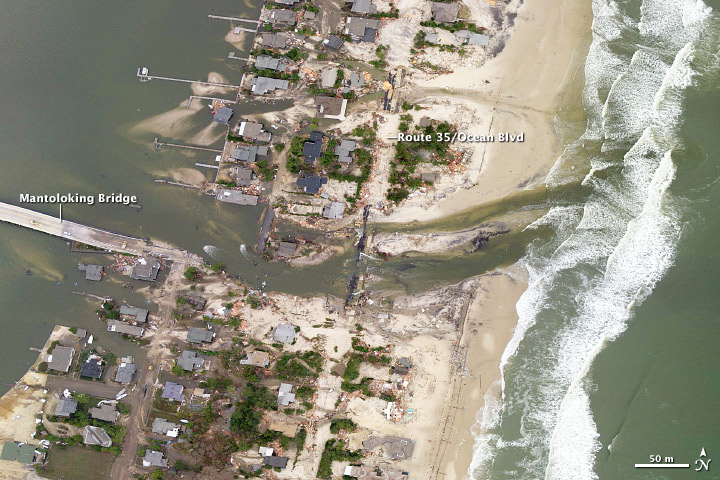
Damage to the barrier island by Hurricane Sandy in Mantoloking, NJ
Hurricanes are intense low-pressure weather systems that form in tropical waters. Hurricanes are classified by wind speeds in categories ranging from 1 with wind speeds of 74 mph to 5 with wind speeds in excess of 155 mph. Hurricanes are very powerful storms that can cause widespread damages to communities in their paths. The images on the right show Hurricane Sandy, which hit the Mid-Atlantic coast in October of 2012, as well as its impact.
Background

Sandy as seen from above, just as it made landfall.
Hurricane Season begins on June 1st and continues through November 30th. Hurricanes being as an area of low pressure known as a disturbance, if circulation becomes more organized the storm is upgraded to a tropical storm and when sustained winds reach 74 mph it is classified as a hurricane. Hurricanes can cause catastrophic damage to areas in their paths. Take a moment and answer the following questions, to recall some information you may previously learned about hurricanes.
Question 1: Winds from a hurricane can be very destructive; can you name and describe another factor of the storm that can also be destructive, maybe even more so than winds?
Question 2: Name and give a brief description of the three main parts of a hurricane, which is typically the most destructive?
Challenge
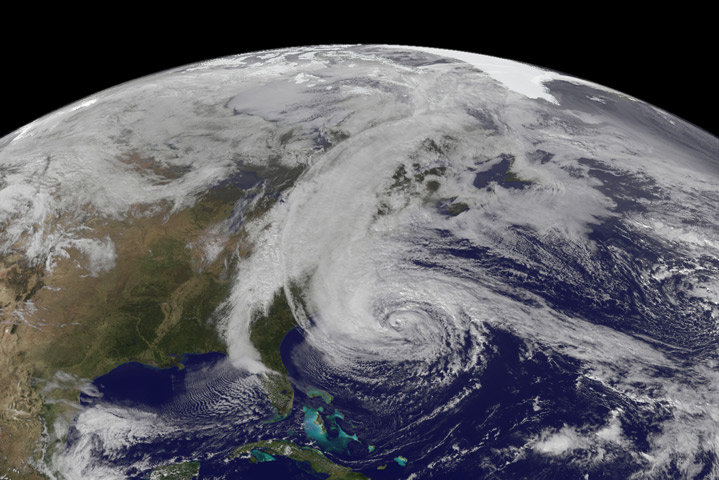
GOES View of Hurricane Sandy
In this activity you will investigate the following research challenge...
Analyze data from several buoys to describe how waves and sea level respond to a passing hurricane.
Explore the Data
Analyze the datasets below to determine the impacts Hurricane Sandy had on the coast of New Jersey. Investigate each piece of evidence and answer the investigation questions on each page. After viewing all of the data, continue to the Explanation page for instructions on how to answer the Challenge question. You will need to justify your answer based on the evidence you review here.


When you're done investigating each dataset, continue to the last section.
How did Sandy form? Was it like Katrina?
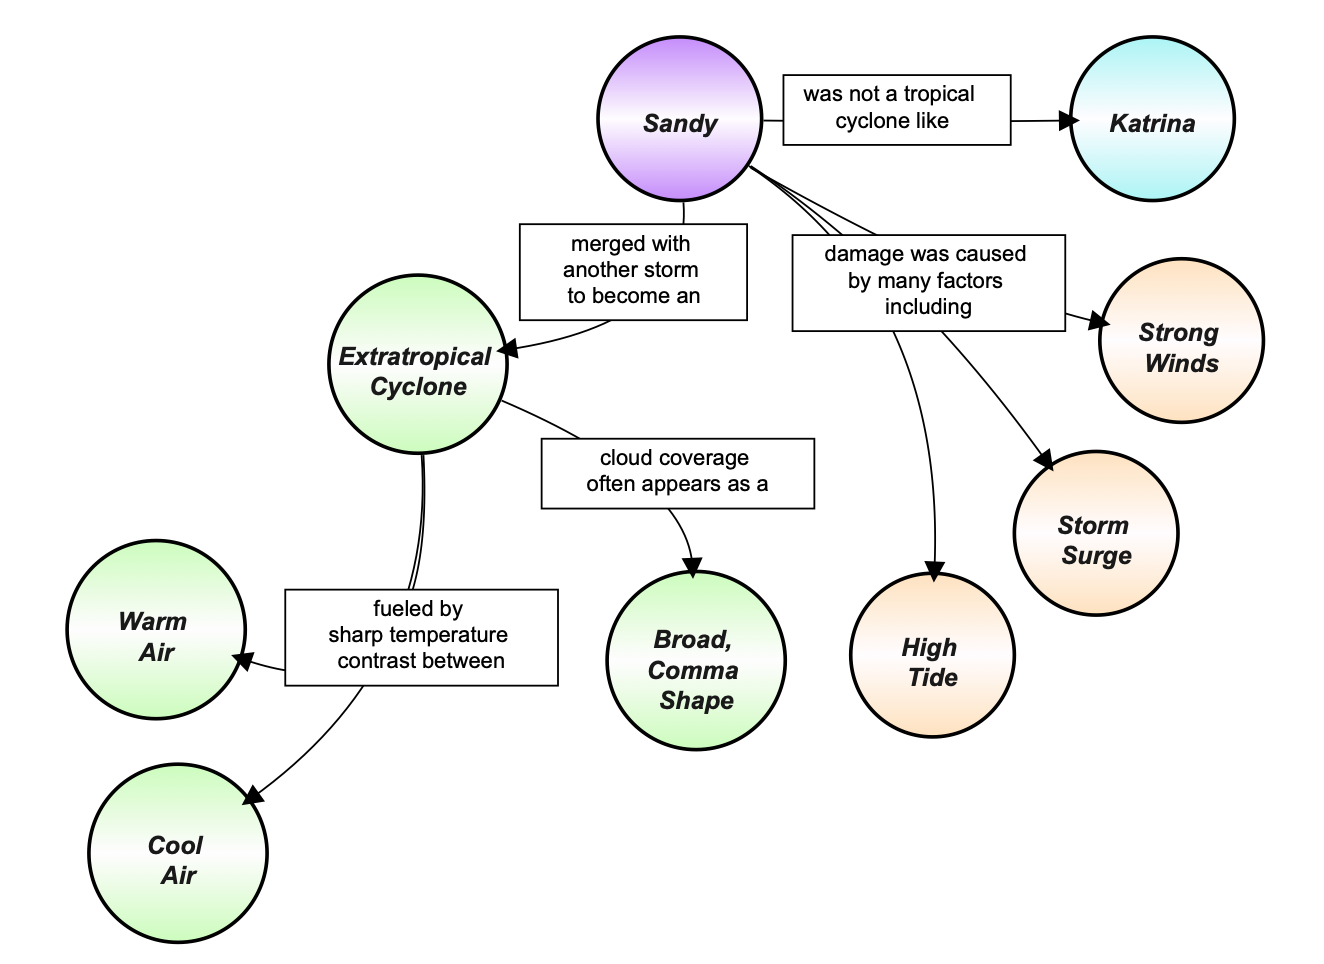
This concept map, developed by Annette deCharon at the University of Maine, details some of the differences between Hurricane Sandy and Hurricane Katrina.
Hurricane Sandy Winds, Waves and Air Pressure
This visualization shows the air pressure, waves and winds at 2 buoys off the New Jersey coast, during the week when Hurricane Sandy hit.
Stations
- 44065 NY Harbor
- 44009 Delaware
Interpretation Questions
- Compare the timing of the air pressure lows between the two stations.
- Compare the maximum wave heights reached at the two stations.
Water Levels During Hurricane Sandy
This visualization shows the measured and predicted tides at several locations along the mid-Atlantic coast, during the week when Hurricane Sandy hit.
Stations
- 8570283 Maryland
- 8534720 Atlantic City
- 8531680 Sandy Hook
- 8518750 NYC Battery
Interpretation Questions
- Which stations have higher maximums? Which have lower ones?
- What is the difference in water heights between the maximum reached during Sandy and a typical maximum for each station?
The Winds of Sandy
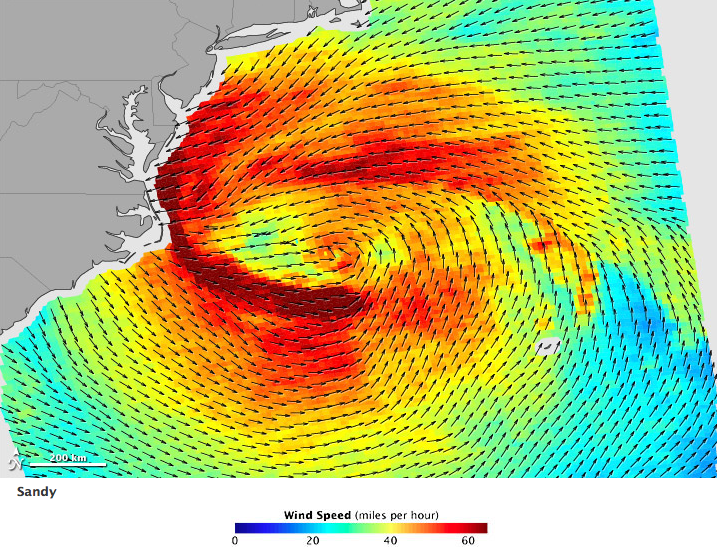
The image above shows the strength and direction of Sandy's ocean surface winds on October 28, 2012. Wind speeds above 65 kilometers (40 miles) per hour are yellow; above 80 kmph (50 mph) are orange; and above 95 kmph (60 mph) are dark red. For tropical cyclones in the northern hemisphere, the strongest winds are usually just east of the eye amidst a ring of violent thunderstorms called the eyewall. However, for Sandy the weakest winds are to the East, which was a result of the cyclone interacting with another storm system. (Credit: NASA Earth Observatory)
Interpretation Questions
- On which side of the storm are the winds heading towards the coast?
- How might this impact sea level?
Develop an Explanation
Recall that the research challenge you are trying to address is:
Analyze data from several buoys to describe how waves and sea level respond to a passing hurricane.
As you consider the data you just investigated, consider the following questions:
- What were the atmospheric responses to Hurricane Sandy?
- How did the ocean respond?
- How did the response differ based on which side of the storm a station was on?
- How should emergency response managers take this information into account when planning evacuations for future storms?
Assessment
Additional Instructions
Using the datasets provided, describe how waves and sea level along the coast of New Jersey responded as Hurricane Sandy approached. Include an analysis of how the response varied along the coast, and how that variation compared with the location of the storm.