Is Overfishing Creating a Population Bottleneck?
Introduction
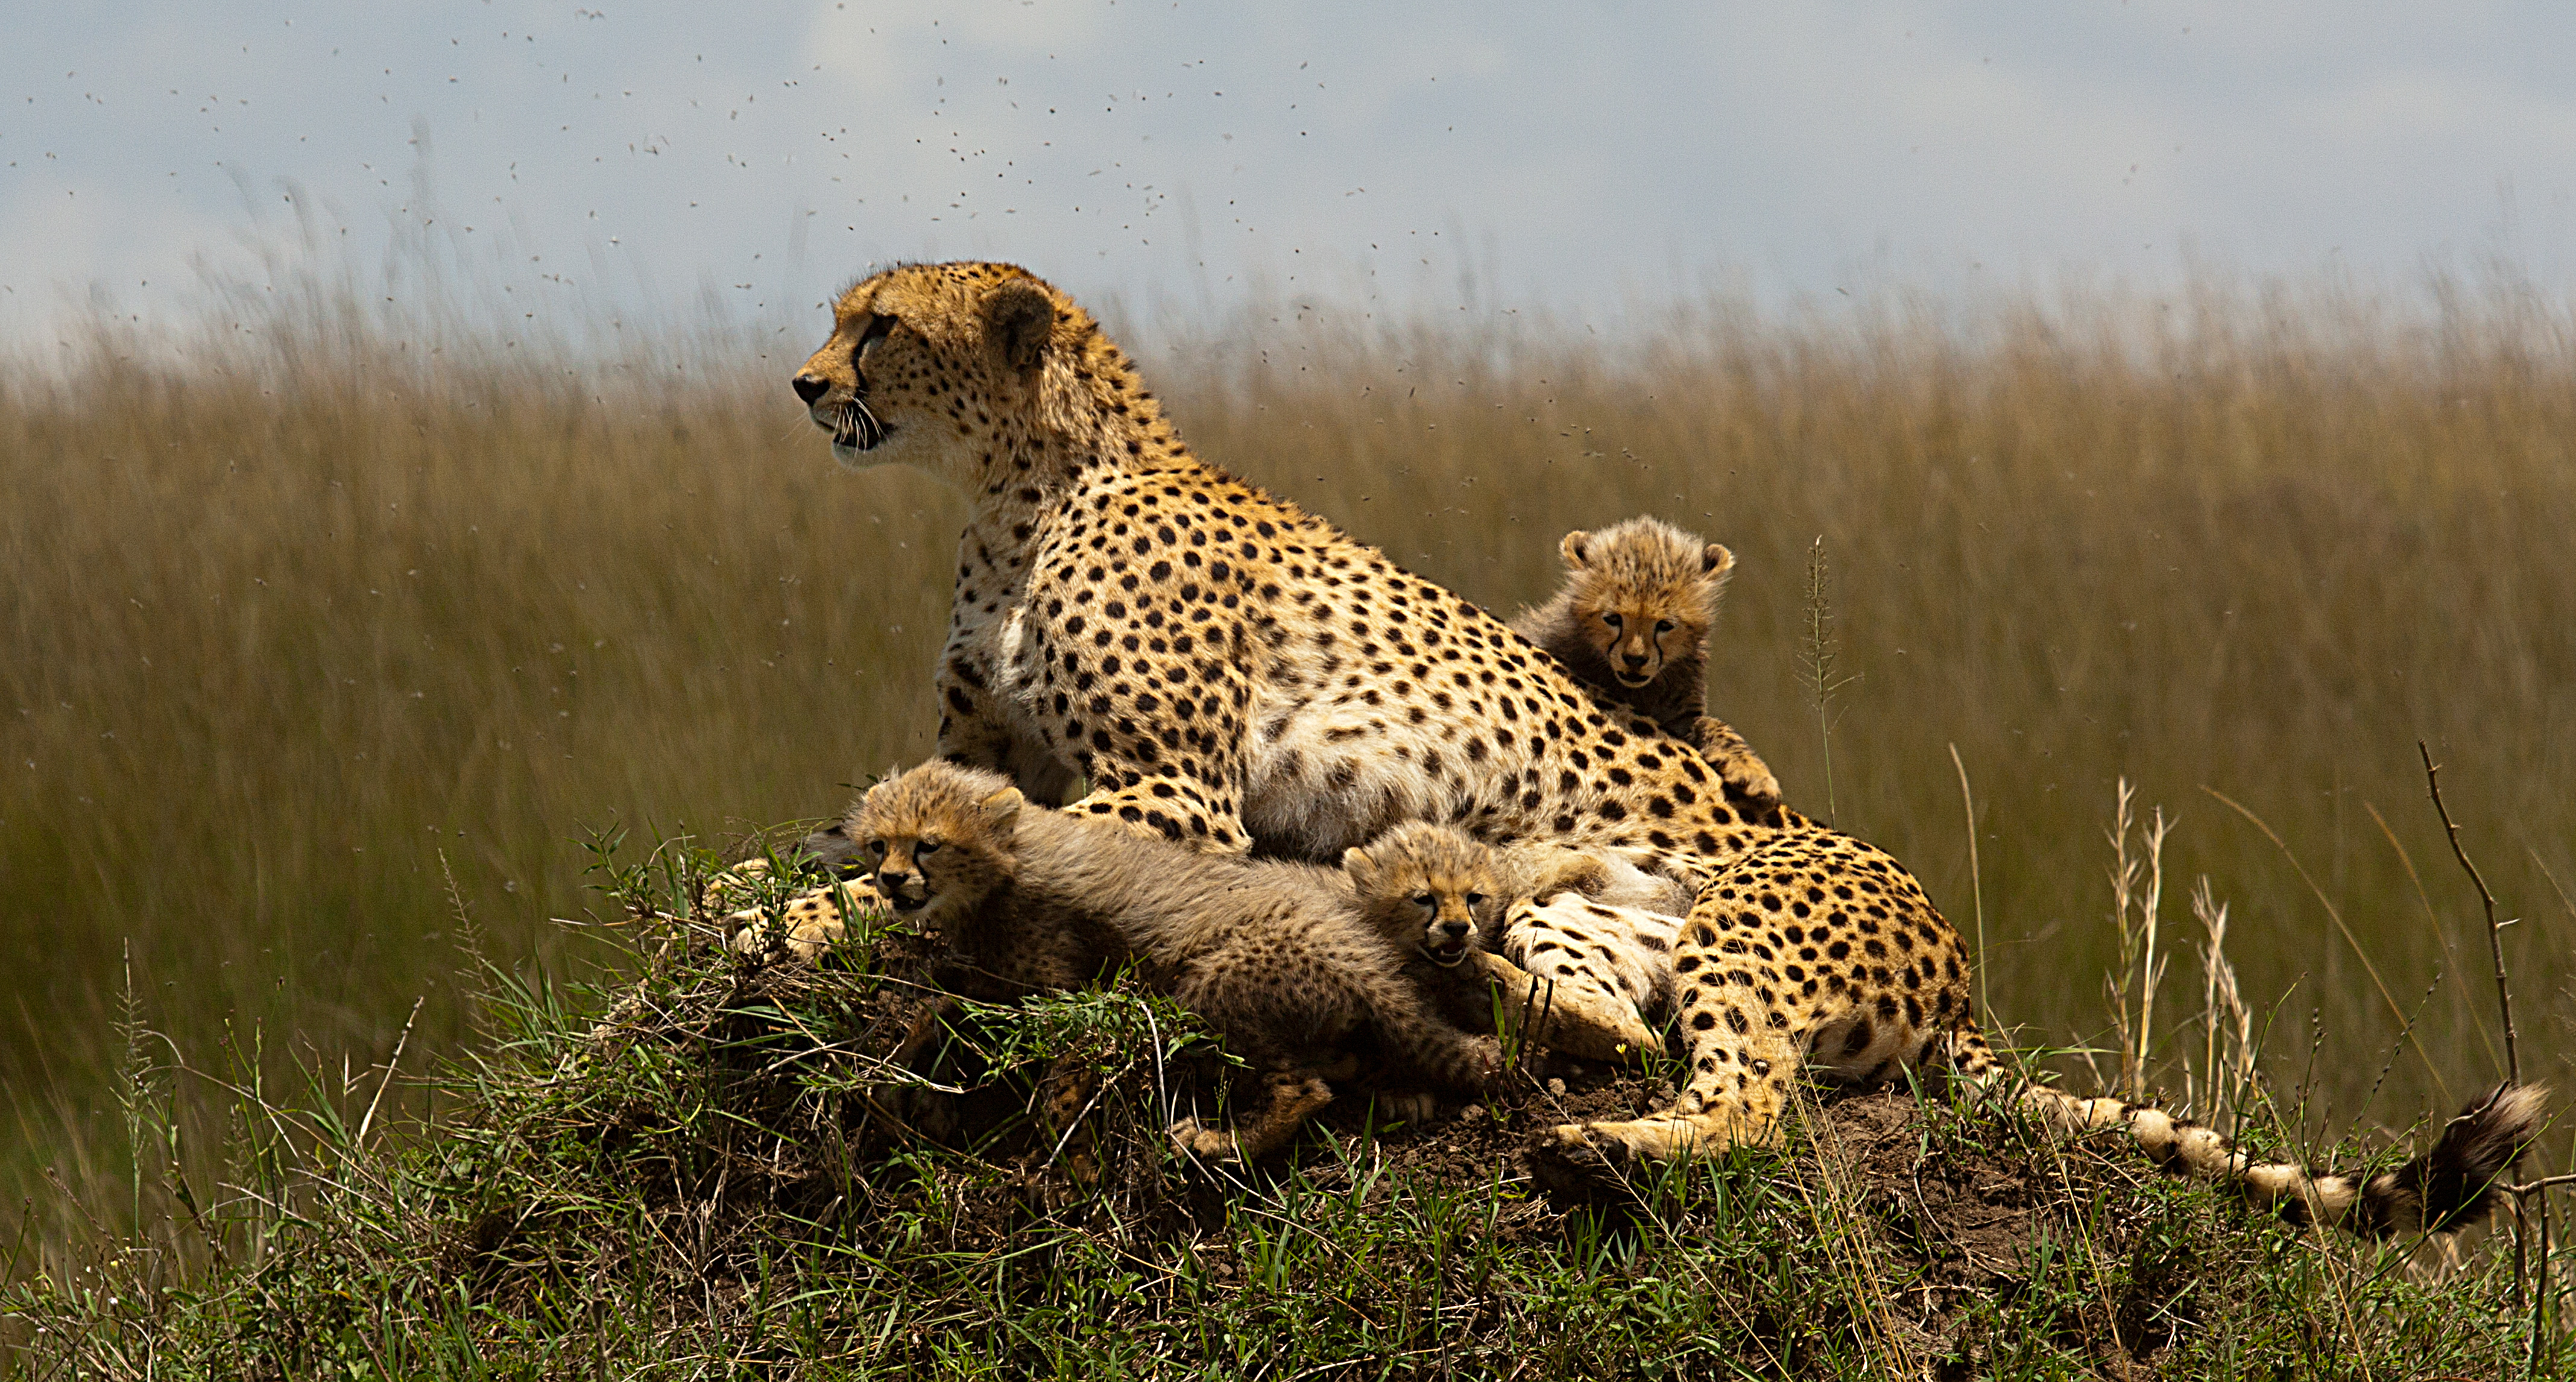
Evolution is due to changes in the allelic frequency in a population over time. The speed with which these changes happen can be dramatically increased when a population bottleneck occurs (due to environmental events or human activities). For example, Cheetahs experienced a large decline in population size due to changing climates ~10,000 years ago initially and then due to over-hunting in Africa over the past few centuries. Therefore, cheetahs now have some of the lowest genetic diversity of organisms on Earth today; approximately 99% of genes are the same in related Cheetahs as opposed to on average 80% for other organisms.
But how do we know that a population bottleneck is happening and what factors may contribute to this change in genetic diversity?
Background

Pelagic fish in schooling pattern. (Photo courtesy of NOAA)
As highlighted in the previous Cheetah example, human activities can produce a population bottleneck, scientists became interested in looking at whether overfishing was having an impact on the genetic diversity of fish. Early studies used a Before-After approach to investigate the question of a relationship between genetic diversity and overfishing. Some studies found a decrease in genetic diversity after overfishing, while other studies found no change in the genetic diversity of fish populations after overfishing. Unfortunately, the experimental design of previous studies meant that they had low statistical power and thus may not have been able to see an effect even if one existed.
Therefore, Pinsky & Palumbi (2013) used a Control-Impact approach to look at 11,000+ microsatellites (rather than 5-10) across 140 species (rather than 1) to determine if there was a relationship between overfishing and genetic diversity, or if overfishing was producing a population bottleneck. Pinsky & Palumbi (2013) grouped fish populations by genus or family and into overfished and not overfished categories to conduct the analyses on both heterozygosity and allelic richness (the number of alleles per locus, which is the data included in this investigation).
Question 1: Why, or why not, would overfishing have an impact on the genetic diversity of a fish population?
Question 2: If overfishing is producing a population bottleneck, what patterns or relationship would you look for in the data?
Challenge
Pelagic fish in schooling pattern. (Photo courtesy of NOAA)
In this activity you will investigate the following research challenge...
Use the data to construct a written explanation of the relationship between overfishing and genetic diversity to determine if overfishing results in a population bottleneck.
Explore the Data
Analyze the data below to determine the impacts of overfishing on genetic diversity. Investigate each piece of evidence and answer the investigation questions for each dataset. It is recommended that you observe the data from the two subsets, which each have only three fish groupings, before looking at the overall (All Fish Groupings) data. After viewing all of the data, continue to the Explanation page for instructions on how to complete the Challenge. You will need to justify your answer based on the evidence you review here.
")
")
")
When you're done investigating each dataset, continue to the last section.
Average Allelic Richness by Fish Grouping (Seabreams, Tunas, & Flounders)
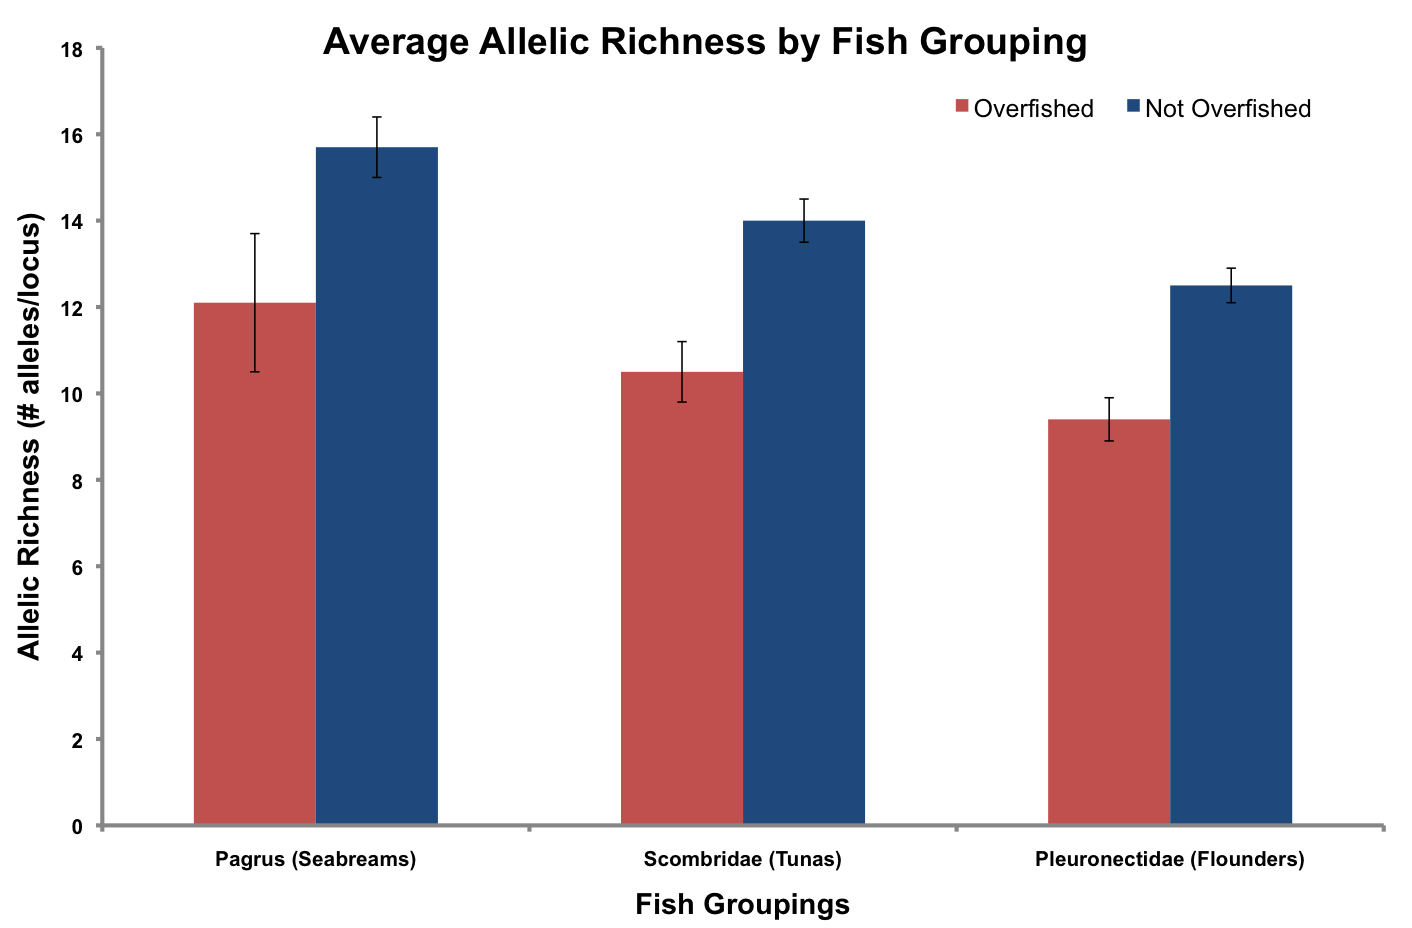
This data visualization represents the average allelic richness for overfished and not overfished species within three fish groupings (Seabreams, Tunas, and Flounders) with the standard error.
Interpretation Questions
- What relationship is there between overfished and not overfished Seabreams? Tunas? Flounders?
- What do these data overall illustrate about the relationship between overfishing and genetic diversity?
- How do these data influence your conclusions about the relationship between overfishing and genetic diversity?
Average Allelic Richness by Fish Grouping (Rockfishes, Groupers, & Snappers)

This data visualization represents the average allelic richness for overfished and not overfished species within three fish groupings (Rockfishes, Groupers, and Snappers) with the standard error.
Interpretation Questions
- What relationship is there between overfished and not overfished Rockfishes? Groupers? Snappers?
- What do these data overall alone illustrate about the relationship between overfishing and genetic diversity?
- How do these data influence your conclusions about the relationship between overfishing and genetic diversity?
Average Allelic Richness by Fish Grouping (All Fish Groupings)
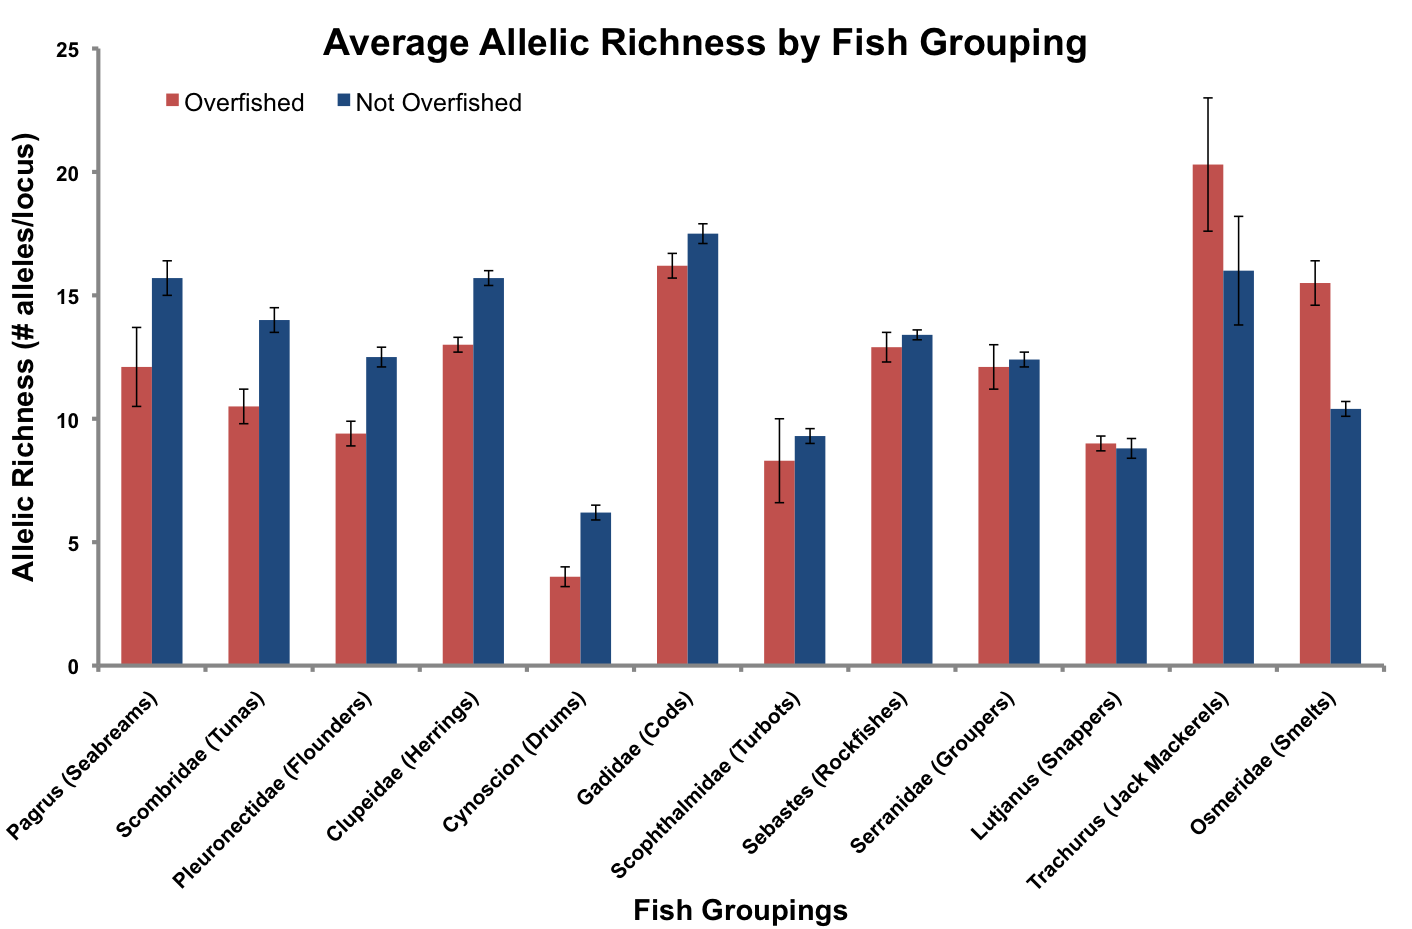
This data visualization represents the average allelic richness for overfished and not overfished species within all twelve fish groupings with the standard error. The fish groupings analyzed include: Seabreams, Tunas, Flounders, Herrings, Drums, Cods, Turbots, Rockfishes, Groupers, Snappers, Jack Mackerels, and Smelts.
Interpretation Questions
- What conclusions do you draw from this figure of the entire dataset?
- What does all the data illustrate about the relationship between overfishing and genetic diversity?
Develop an Explanation
Recall that the research challenge you are trying to address is:
Use the data to construct a written explanation of the relationship between overfishing and genetic diversity to determine if overfishing results in a population bottleneck.
As you consider the data you just investigated, consider the following questions:
- What was the relationship between overfishing and genetic diversity overall?
- Was the relationship between overfishing and genetic diversity the same for all fish groupings?
- Were the overall observed patterns in the data what you expected in terms of the relationship between overfishing and genetic diversity? Why or why not?
- Were the results from each fish group what you expected? Why or why not?
- Does overfishing result in a population bottleneck?
Assessment
Additional Instructions
Using the data provided, describe the relationship between overfishing and genetic diversity in fish populations. Provide a written explanation of this relationship incorporating your data analysis, identifying the evidence you used, and addressing the summary questions below.