Ocean Acidification
Introduction
Carbon dioxide (CO2) is a greenhouse gas, that humans are releasing into the atmosphere at rates exceeding historical values. In 2011, CO2 accounted for 84% of all greenhouse gas emissions, and between 1990 and 2011 emissions had increased by 10%. We know that the release of greenhouse gases are increasing air temperatures. However, this increase is not only affecting the atmosphere, it is also having an impact on the ocean as well. CO2 in the atmosphere mixes with the ocean via gas exchange. This causes a chemical reaction to occur in the ocean that is causing changes in both biological and physical properties of the ocean. These changes can have a serious impact on life as we know it.
Background
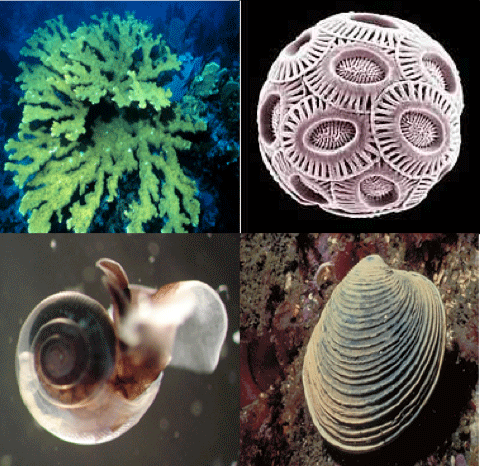
How will changes in CO2 impact organisms like these?
Human activities, such as the burning of fossil fuels for energy, are increasing the amount of carbon dioxide (CO2). This is having an impact on the ocean, most notably to the types of organisms pictured to the right.
Take a moment and answer the following questions about this image.
- Question 1: What are some things that these organisms have in common?
- Question 2: How do these organisms build their shells?
- Question 3: Where do you think the carbon in their shells comes from?
- Question 4: How do scientist make predictions about what future conditions might look like?
Challenge
In this activity you will investigate the following research challenge...
What relationship is there, if any, between increased levels of carbon dioxide in the atmosphere and the physiological changes that are occurring in calcifying organisms.
Explore the Data
Analyze the datasets below to learn more about Ocean Acidification. Investigate each piece of evidence and answer the investigation questions for each dataset. After viewing all of the data, continue to the Explanation page for instructions on how to answer the Challenge question. You will need to justify your answers based on the evidence you review here.


When you're done investigating each dataset, continue to the last section.
Atmosphere CO2 and pH
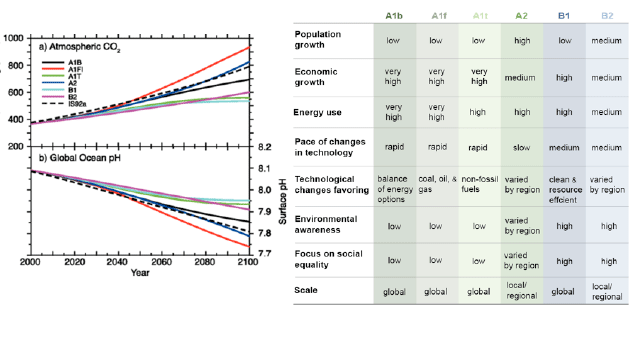
The graph above shows different scenarios based upon population, economic growth, etc. as predicted by the IPCC (Intergovernmental Panel on Climate Change) The top chart shows projected CO2 levels from 2000 to 2100, the bottom global pH levels for the same timeframe. The different lines represent different emission scenarios. (credit IPCC).
Interpretation Questions
- 1. According to the IS92a scenario by how much is atmospheric CO2 levels expected to change between 2010 and 2080? What is the projected change in global ocean pH for the same time period?
- 2. Which scenarios show the most dramatic change in terms of pH? What are the conditions of this scenario?
- 3. Why is a small change in pH so large?
pH and Oceanic Dissolved Carbon Dioxide
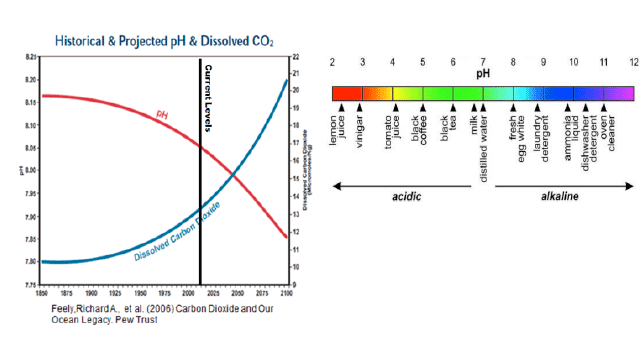
This graph combines historical data with predictions made using models to show pH and oceanic dissolved carbon dioxide over time.
Interpretation Questions
- 4. What trend do you notice in pH over time, is it different than the trend in dissolved CO2 over time?
- 5. What is the projected change in pH from the years 1850 to 2050?
- 6. Using the pH colorbar above, by the year 2100 what solution will our ocean's waters most be like?
Dissolved CO2, H2CO3, HCO3-, CO32- and pH
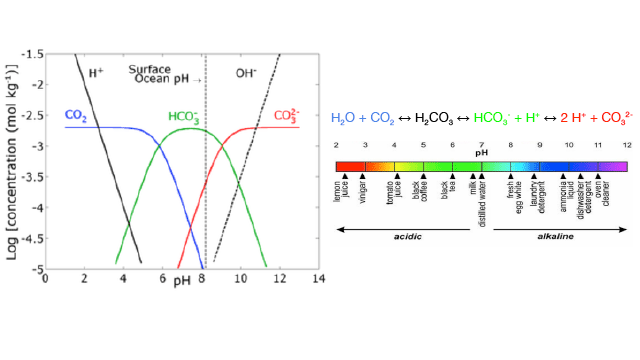
This graph is known as a Bjerrum plot. It shows the proportion of dissolved carbon dioxide (CO2), bicarbonate (HCO3-), and carbonate (CO32-) at different pH levels in a solution at equilibrium.
Credit/Source: TBD
Interpretation Questions
- 7. According to this graph, under acidic conditions, what are the dominate (most prevalent) forms of carbon in solution?
- 8. How does the proportion of CO32- (carbonate) change as pH decreases? Describe this change in terms of the rate of change (i.e. Slope: change in y-axis over change in x-axis)
Atmospheric CO2 over time
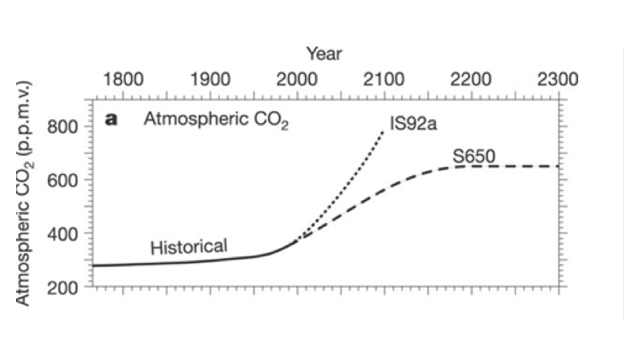
The graph above shows Atmospheric carbon dioxide levels from the 1800's to predicted levels in 2300. Two different IPCC models are used in this graph. IS92a with carbon concentrations increasing at 1% per year after 1990 and is what would be predicted if we continue emitting CO2 at the same rate we do today. S650 is a stabilization scenario, where we begin to decrease CO2 emissions and eventually Atmospheric CO2 levels stabilize.
Interpretation Questions
- 9. If atmospheric CO2 concentrations were to continue to increase by 1% per year, what is the projected level of CO2 in 2100?
- 10. If CO2 levels are stabilized, when will CO2 concentrations begin to level off?
- 11. What are some ways that CO2 levels could begin to stabilize?
Species Response to Increasing CO2

A number of different species from each of the different major group were subjected to increased CO2 levels. The species response was then recorded as either: a. negative, b. positive, c. static, or d. parabolic (responded in a non-linear fashion, the species had a negative response both above and below present day CO2 levels). (table edited from: Doney et. al., 2009.) Note: The numbers for each species response do not add always add up because this information was taken from a review of data collected from multiple experiments, and in some cases a species could have shown multiple responses in different studies, depending on technique and experiment parameters.
Interpretation Questions
- 12. Do all species respond the same to increased levels of CO2 in terms of calcification?
- 13. How do the majority of species studied in this table respond to increasing CO2?
Coccolithophores and Elevated CO2 levels
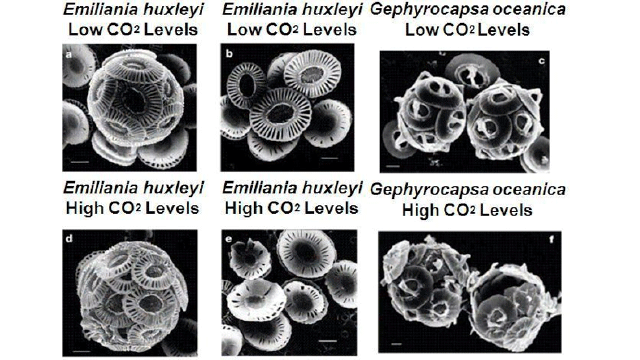
Above are scanning electron microscopy (SEM) images of coccolithophores. The coccolithophores were subjected to different levels of CO2 (described in the table on the right).
Interpretation Questions
- 14. Describe the physical differences you see between Emiliania Huxleyi under lower CO2 levels verse higher CO2 levels.
- 15. Do both species respond similarly to increased CO2 levels?
M. mercenaria Grown Under Different CO2 Concentrations

The images above are scanning electron microscopy (SEM) of M. mercenaria (a type of saltwater clam) for 36 days. They were grown under different CO2 levels ranging from 250 ppm to 1500 ppm.
Interpretation Questions
- 16. As CO2 levels increase, what trend do you notice in the growth of M. mercenaria?
Net Calcification, CO2, Carbonate, and pH
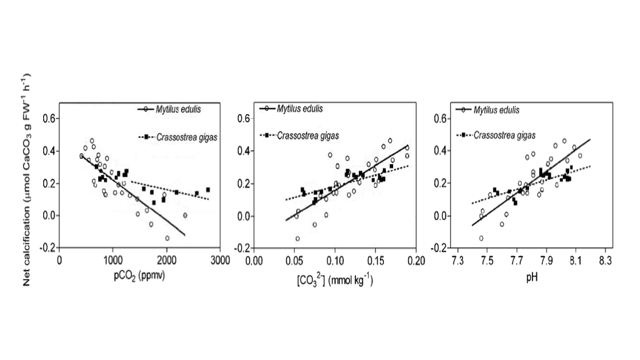
The graphs above show the relationship between net calcification and Partial Pressure of CO2, Concentration of carbonate ions, and pH for two different species, mytilus edulis (blue mussel) and crassostrea gigas (pacific oyster). Net calcification is given in µmol CaCO3 g FW-1h-1 or how much calcium carbonate will be lost per hour.
Interpretation Questions
- 17. By how much does net calcification decrease when you go from a pH of 8.1 to a pH of 7.5 for blue mussels? What about pacific oysters?
- 18. By how much does net calcification change of mussels when you increase partial pressure of CO2 from 1000 to 2000 ppmv?
- 19. Is it better to have a carbonate ion concentration of .15 mmol kg-1 or 0.05 mmol kg-1?
Develop an Explanation
Recall that the research challenge you are trying to address is:
What relationship is there, if any, between increased levels of carbon dioxide in the atmosphere and the physiological changes that are occurring in calcifying organisms.
As you consider the data you just investigated, consider the following questions:
- Create a conceptual model making a connection between CO2 emissions and marine organism calcification.
- Does your data support a link between CO2 levels and calcification rates in marine organisms? Explain this link?
- Explain in words, the connection between Atmospheric CO2 levels and a change in ocean pH.
- Based on the IPCC scenario IS92a what are predicted ocean conditions and how will this effect calcifying marine organisms?
- What effect will increased CO2 levels have on the food web in the ocean?
- What effect will increased CO2 levels have on human industries such as fisheries and tourism?
- In your opinion, what else do scientists need to investigate in order to better understand the link between CO2 and calcifying organisms?
Assessment
Additional Instructions
As you take into account the data you just viewed, consider questions #1-3 as you try to summarize what you have learned. Then consider questions #4-7 and try to extrapolate your knowledge based on what you have learned.