Seismic Features at a Seamount Exploration
Your Objective
Use earthquake data at Axial Seamount to look if there are patterns over 3 months in spring 2015.
- Make a prediction about what kind of patterns in earthquake magnitude, depth, and location you may observe over time at an active seamount.
- Explore the data below to see what you can observe.
Automatically select:
Data Tips
When the site loads, you are able to see all of the earthquake data from March 1-7, 2015 around the Axial Seamount. You can interact with the data by:
- Selecting a different part of the time series to explore the data in ways that interest you by moving the highlighted section of the bottom graph to the right or left.
- Zooming in and out of the amount of data to look at different time scales that interest you by changing the width of the highlighted section of the bottom graph (it loads with only data from March 1-7, 2015 highlighted).
- Zooming in and out of the map to see more or less of the area of the Axial Seamount where earthquakes occurred.
Note, the color denotes earthquake depth, with darker blues representing deeper depths (up to 5km) and dark red representing shallower depths (0km). The yellows are in-between. The circles on the map are sized by the earthquake magnitude.
Questions for Thought
Orientation Questions
- Across what geographic area are you able to observe earthquake data in this map?
- What is the range of earthquake size (magnitude) in these data?
Interpretation Questions
- What changes or patterns did you observe in earthquake location over this time period at Axial Seamount in reference to bathymetric features?
- Where did you see these changes or patterns?
- What changes or patterns did you observe in earthquake magnitude over this time period at Axial Seamount?
- What changes or patterns did you observe in the relative number of earthquakes that occurred during a week over these 3 months at Axial Seamount?
- What questions do you still have about what we can learn about plate boundaries from earthquake data over time?
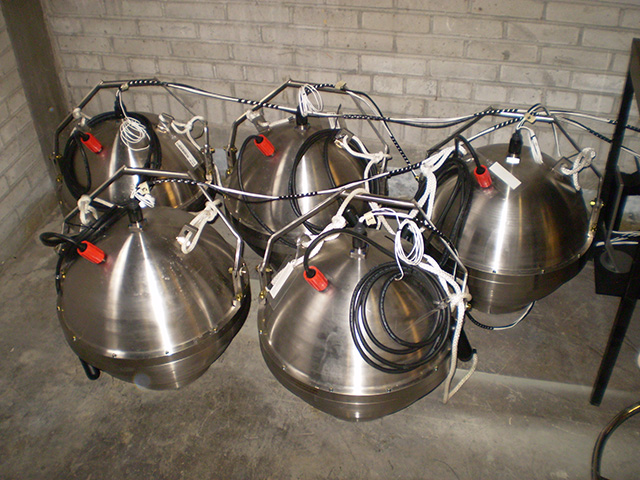
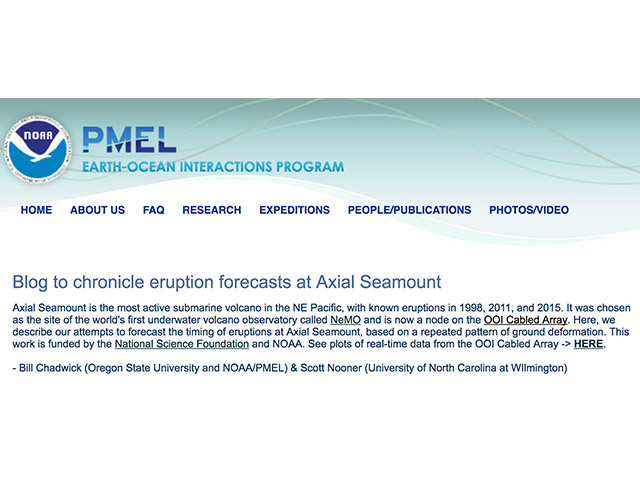
Background Information
Click on the images below to learn more about where and how the dataset above was collected.

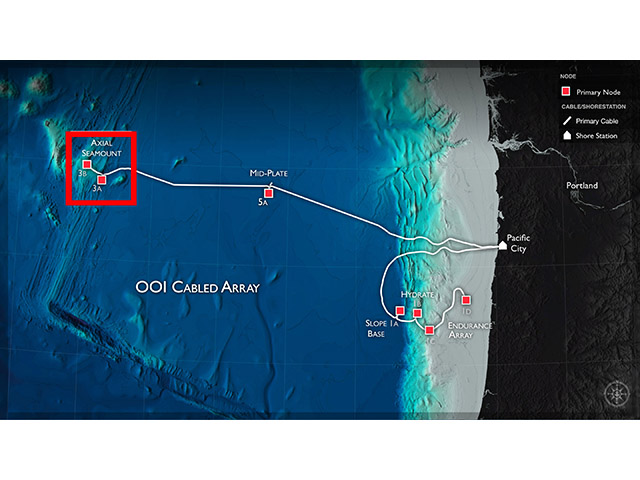
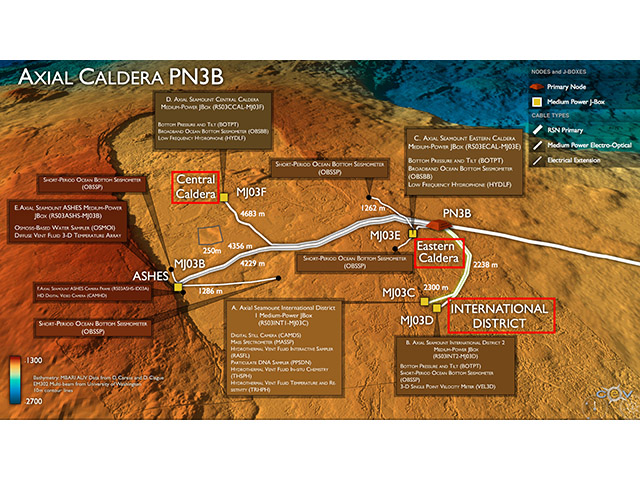
Dataset Information
- The data used in this activity is from: Wilcock, W., Waldhauser, F., & Tolstoy, M. (2016). Catalogs of earthquake recorded on Axial Seamount from January, 2015 through November, 2015 (investigators William Wilcock, Maya Tolstoy, Felix Waldhauser). (Version 1) [Data set]. Integrated Earth Data Applications (IEDA). https://doi.org/10.1594/ieda/323843
- The earthquake catalog data are publicly available in the Marine Geoscience Data System. The data used are from the Axial_DD_n12.dat data file.
- To learn more about this diking-eruptive event, see Wilcock, W., M. Tolstoy, F. Waldhauser, C. Garcia1, Y. Joe Tan, D. Bohnenstiehl, J. Caplan-Auerbach, R. Dziak, A. Arnulf, and M. Mann. (2016) Seismic constraints on caldera dynamics from the 2015 Axial Seamount eruption. Science. 354(6318): 1395-1399. https://doi.org/10.1126/science.aah5563