Seamount Diking-Eruption Event Science Application
Your Objective
Use data about the change in seafloor elevation from an active volcano in the North Pacific Ocean to determine what the are patterns over time in terms of when eruptions occur and to make a prediction.
- Explore the data below to see what you can observe about how the seafloor changes height before, during, and after an eruption.
- Use your cursor to draw your prediction on the graph of when the next eruption may occur.
Data Tips
When the site loads, you are able to see the changes in the elevation of the seafloor around the Axial Seamount from 1997-2016 above where magma often builds up just below the seafloor until enough pressure builds for a diking-eruption event. You can interact with the data by:
- Zooming in and out of the data to look at different time scales that interest you by changing the width of the highlighted section of the bottom graph (it loads with all of the data highlighted).
- Using your cursor to make a prediction of what the data look like going forward after 2016.
Note - The "Estimated Threshold" is an estimation of the amount the seafloor rises (inflates) before which an eruptions follows.
Questions for Thought
- Across what time periods are you able to observe changes in the seafloor data in this graph?
- Across what range of seafloor elevation are you able to observe in this graph?
- At what amount of change in seafloor elevation is the estimated threshold for when a diking-eruption will likely follow?
- What changes or patterns did you observe in changes in seafloor elevation between 1997-2016 at the Axial Seamount?
- Were these these changes or patterns driven by how much time had passed? What is your evidence?
- Were these changes or patterns driven by how much of a chance in the seafloor elevation had occurred? What is your evidence?
- How did you use those changes or patterns from 1997-2016 to help make your prediction of when the next diking-eruption event may occur? What is your evidence?
- What questions do you still have about how we use data of change in seafloor depth over time to predict when the next diking-eruption event may occur?
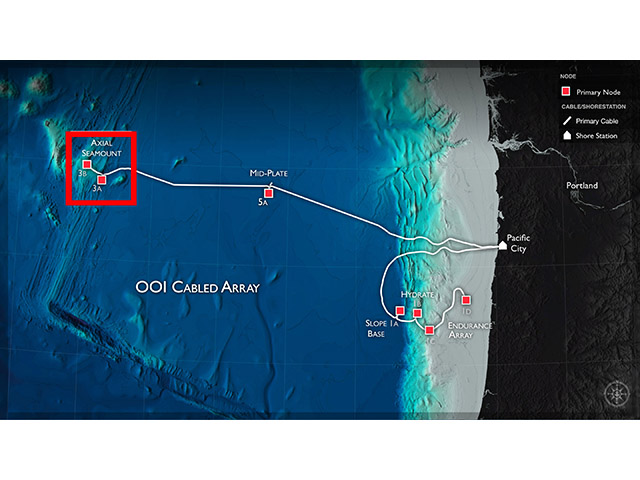
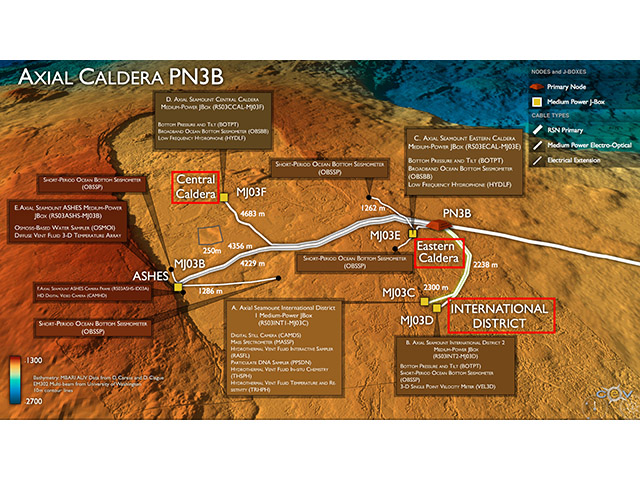
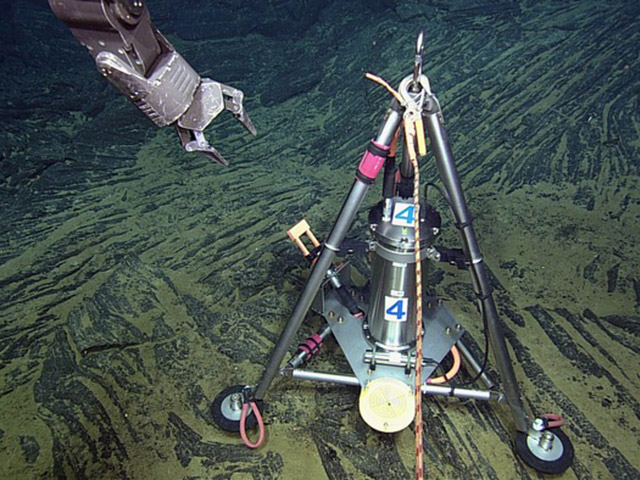
Background Information
Click on the images below to learn more about where and how the dataset above was collected.

Additional Resources
Dziak, R.P., D.R. Bohnenstiehl, J.P. Cowen, E.T. Baker, K.H. Rubin, J.H. Haxel and M.J. Fowler (2007), Rapid dike emplacement leads to eruptions and hydrothermal plume release during seafloor spreading events. Geology., 35(7), 579-582Dataset Information
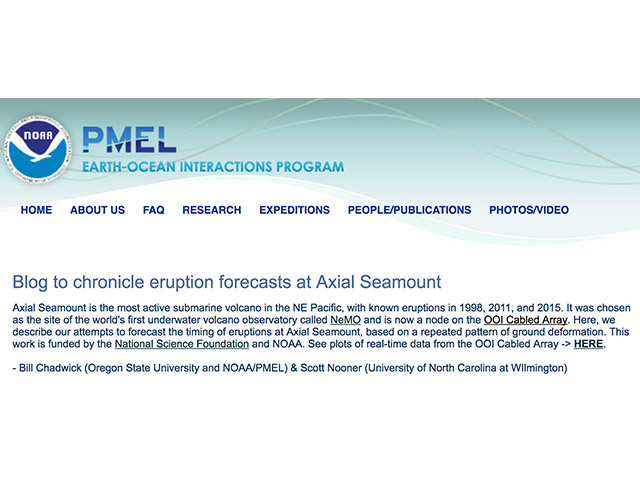
The data in this activity was provided by William Chadwick at NOAA PMEL, and was adapted from Figure 2 in: Nooner, S. L., and W. W. Chadwick, Jr. (2016), Inflation-predictable behavior and co-diking-eruption event deformation at Axial Seamount, Science, 354(6318), 1399-1403, doi:10.1126/science.aah4666.
The data for this activity was collected by the Central Caldera Bottom Pressure and Tilt instrument (RS03CCAL-MJ03F-05-BOTPTA301) on the Cabled Axial Seamount array.
To see the latest data from this instrument, you can check out Bottom Pressure and Tilt page at NOAA PMEL. They also provide a blog that chronicles past and future diking-eruption event forecasts at Axial Seamount.