
Lab 7 – Identify factors that control Primary Production in the western temperate Atlantic Ocean
North Atlantic right whales are one of the most endangered whales in the world. They were traditionally hunted and remain endangered today, with only a few hundred individuals surviving. Scientists are interested in learning more about right whale migration patterns to help protect them and save them from extinction. Recently, scientists discovered that these whales spend significant time feeding along the coast south of Cape Cod, Massachusetts, during March and April while they are moving from the south, where they breed during the winter, to the north where they feed during the summer and fall. These whales are filter feeders and eat a type of zooplankton called copepods, which in turn eat phytoplankton. In this lab activity, you will investigate why the whales’ food is so abundant south of Cape Cod at this time of the year. You will answer this question by looking at the distribution of phytoplankton (chlorophyll), nutrients (nitrate), water temperature, and sunlight (irradiance) in the ocean where these whales feed.


Learning Outcomes
- LO1. Describe patterns in individual data sets and correlations between the different data types presented.
- LO2. Interpret the provided data and hypothesize about how these variables influence each other and why.
- LO3. Explain the relationship between primary production, nitrate concentration, irradiance, and temperature in the western Atlantic Ocean using evidence and relevant scientific concepts to support the hypotheses.
- LO4. Predict patterns over multiple years using knowledge gained from working with a year of data.
Background Information
- Key terms: primary production, chlorophyll, nitrate, surface water temperature, irradiance, abiotic and biotic variables, water stratification, thermocline
- Data collection: We will use data collected by the Ocean Observatories Initiative (OOI), an initiative that has stationed equipment for collecting data in different locations around the world. Our data comes from the Coastal Pioneer Array off the coast of the northeastern part of the USA (see map below).
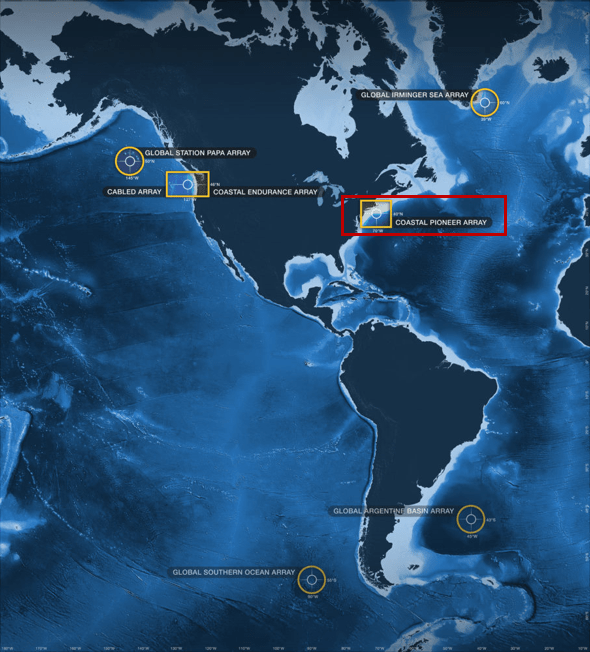
The Coastal Pioneer Array consists of several moorings that include a variety of instruments. The moorings are spread out over slightly different locations near the outer continental shelf (see map below). The data for this lab were collected at three locations within the Coastal Pioneer Array:
- Chlorophyll and water temperature data were collected at the Offshore Surface Mooring (7), the furthest instrument from land, using fluorometer (chlorophyll) and CTD (temperature) sensors
- Nitrate data was collected with a nitrate sensor at the Central Surface Mooring (2)
- Irradiance data was collected at the Inshore Surface Mooring (4) as downwelling shortwave irradiance using a sensor in the bulk meteorological instrument package

Map of the locations of moorings and mobile assets on the Coastal Pioneer Array.
Activities in this Lab
- Lab 7.1 – How does the abundance of phytoplankton vary over the course of a year?
- Lab 7.2 – What is the relationship between chlorophyll and other abiotic variables?
- Lab 7.3 – Can you make predictions for patterns of variation for other years?